 “Search, Analyse, Trade” is a series of Price Action and Elliott Waves analyses. Its detailed step-by-step description can be found over here. I invite you to today’s review of selected currency pairs and potential trading opportunities. The analyses are based on the Dukascopy sentiment that you can get here.
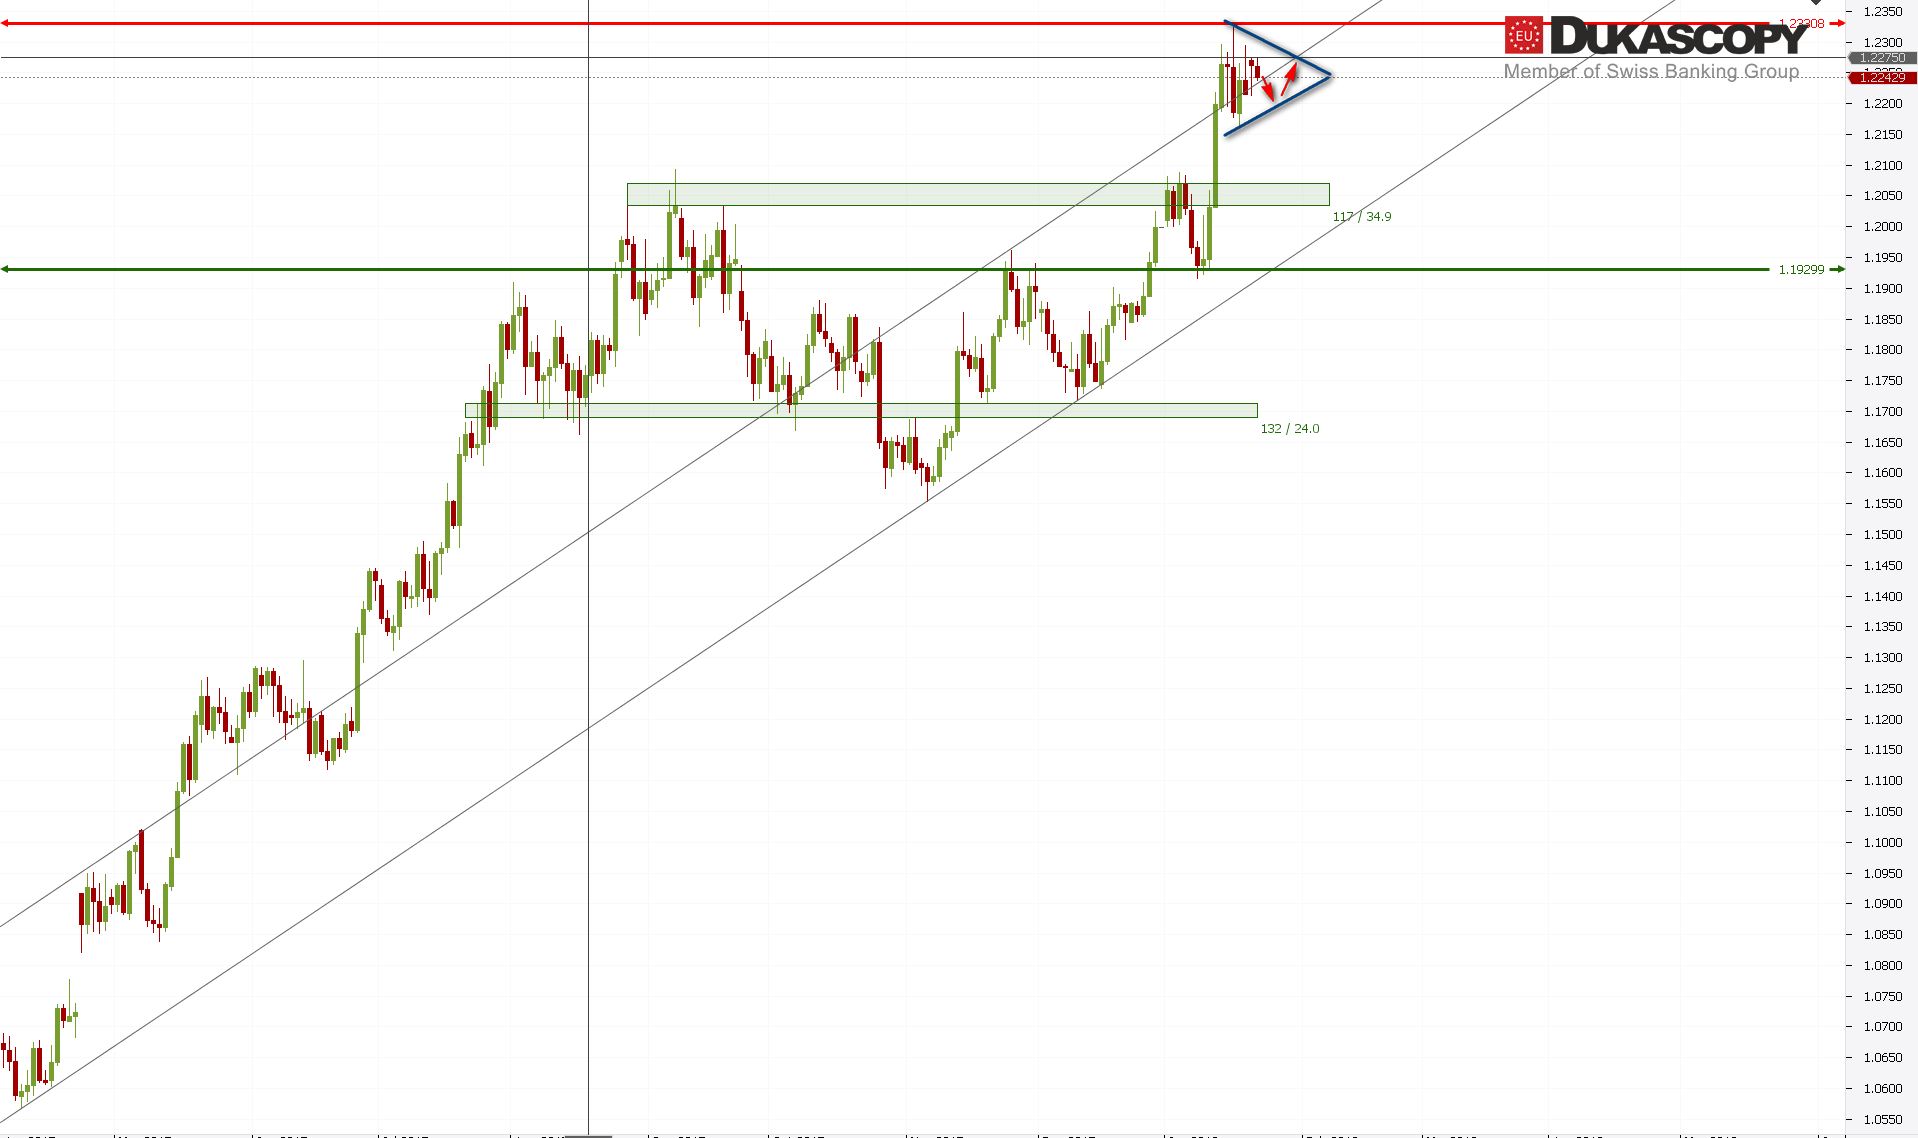
EUR/USD pair remains in consolidation under key resistance. The entire corrective structure slowly begins to resemble a triangle that could be the fourth wave in the third wave. After its completion, we should see another attempt to attack the resistance zone with a high probability of overcoming it.
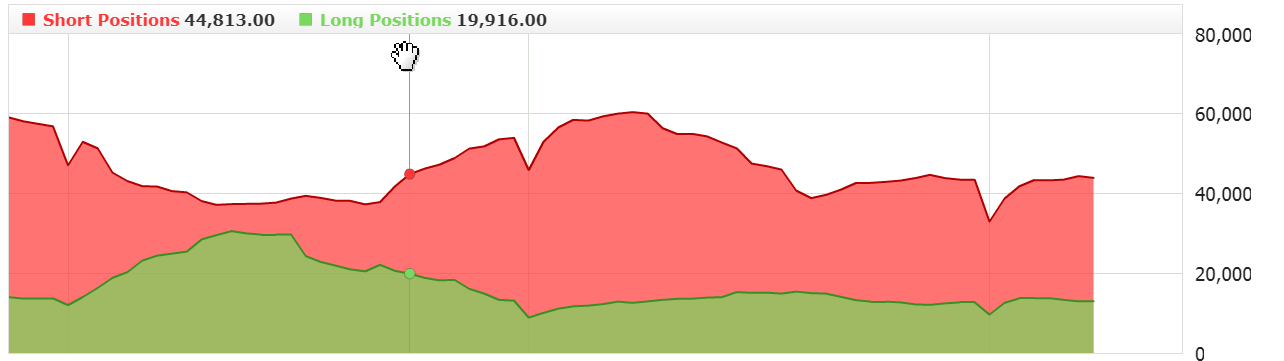 The sentiment remains neutral. Lately we have not seen increase in positions. You can search for an entrance in any direction.
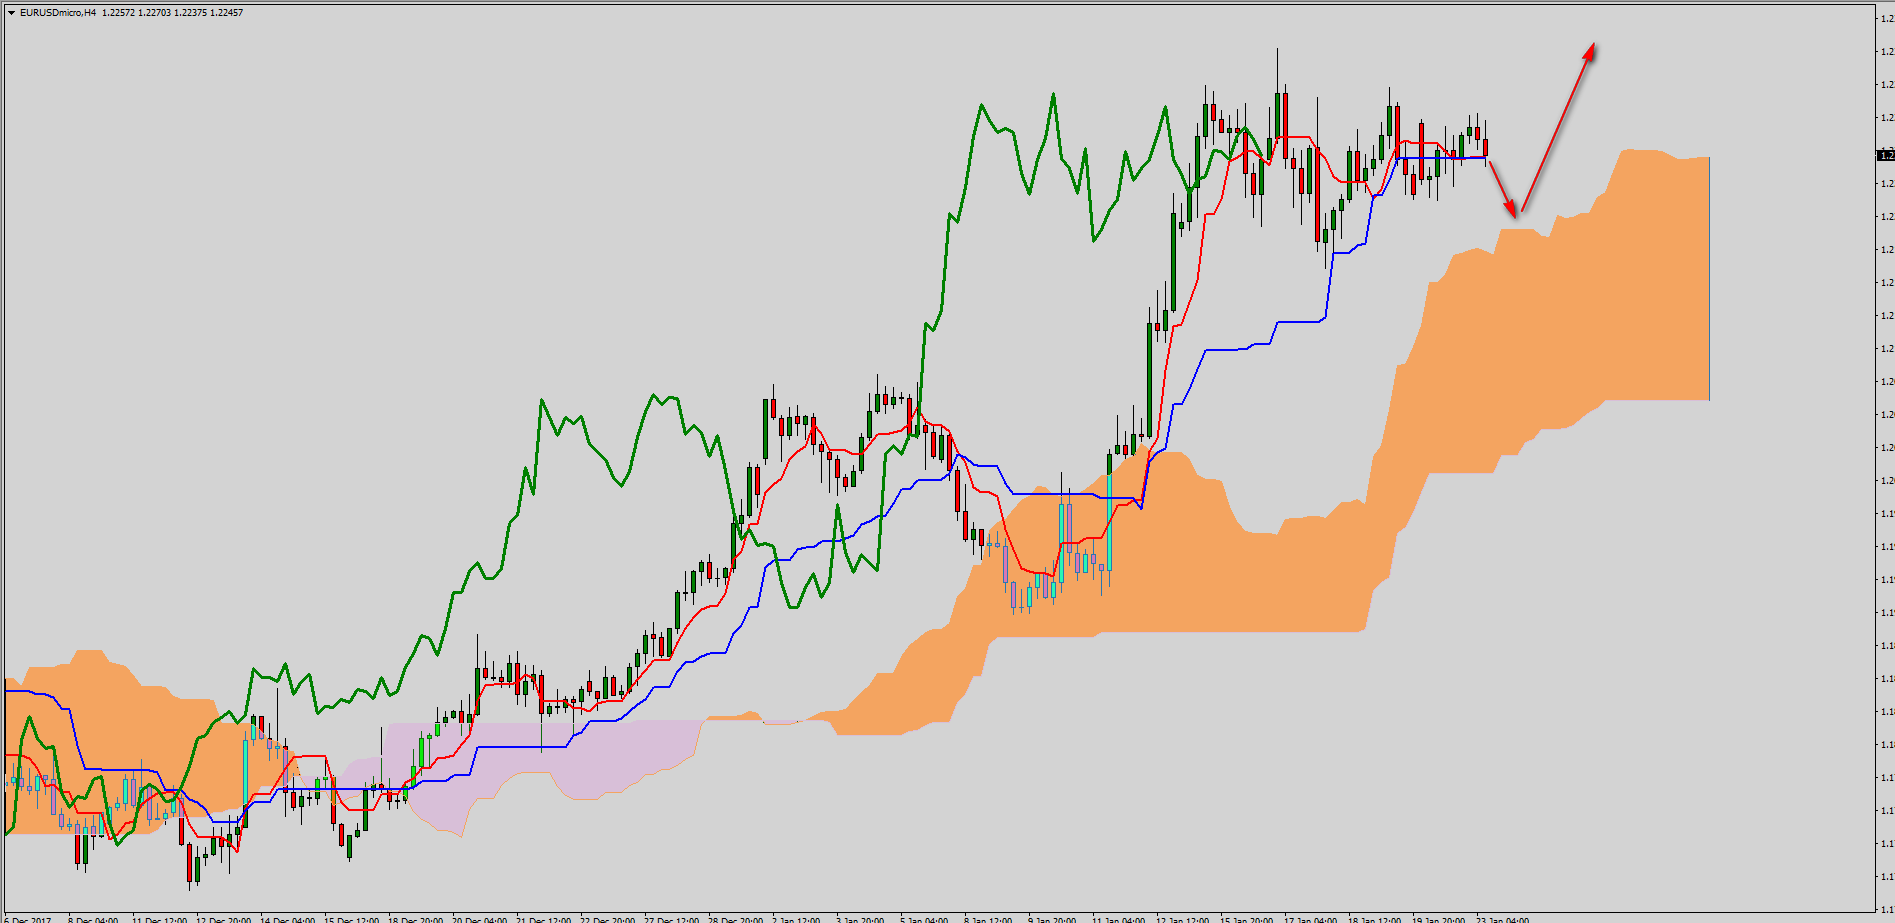 Currently, the pair found support in the Tenakan line from the daily chart, so I will look for longs. On the H4 chart we can see that the line arrangement is typical for the correction. Currently, the pair is testing Kijun lines and if they reach it, we should see a move towards the Senkou Span A. line. There you will be able to search for a position after it is reflected from it or when the gold cross occurs.
The partner of “Search, Analyse, Trade” series is a Dukascopy Europe broker who gives its customers access to ECN accounts in different currencies.
Trade on Forex, indices and commodities thanks to Swiss FX & CFD Marketplace. Open free trading account right now.
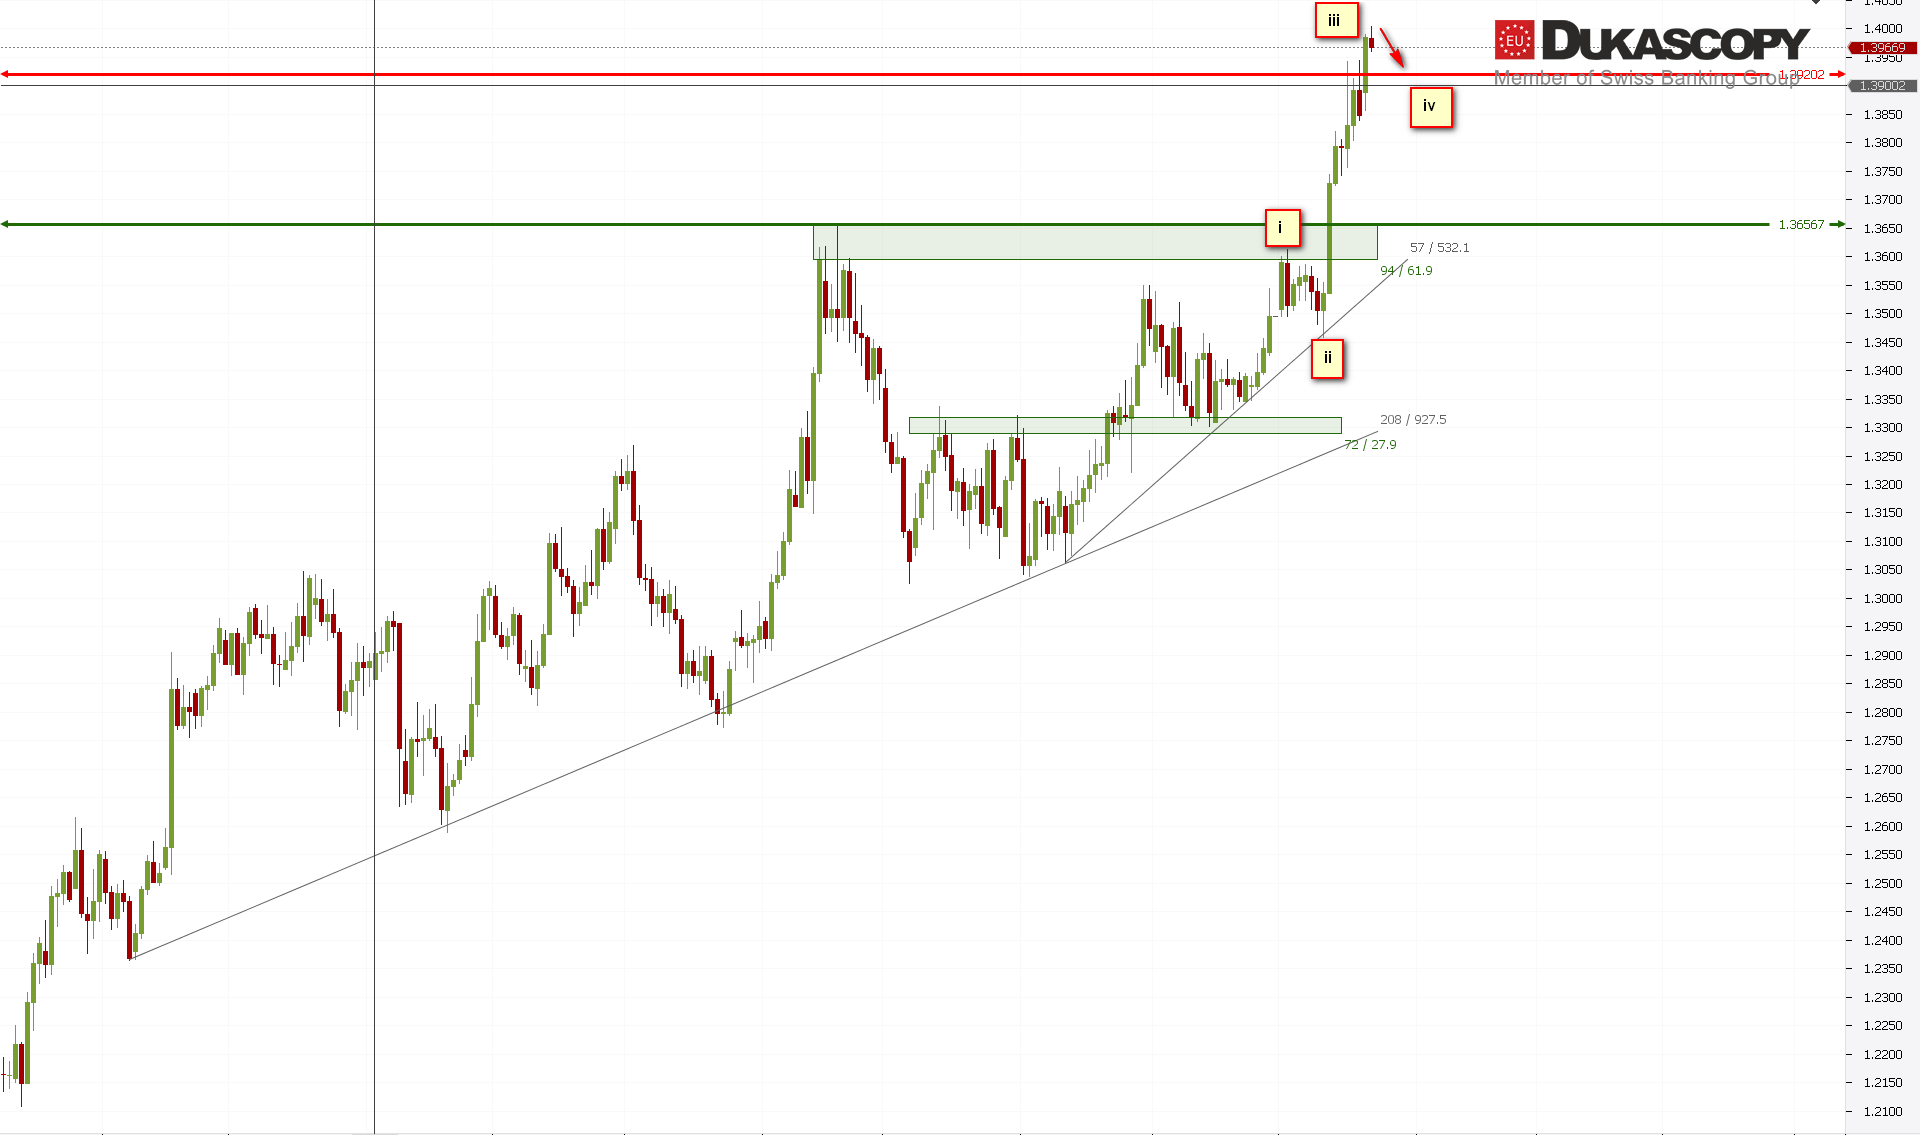
GBP/USD, which is in the third wave, defeated the key resistance zone yesterday and reached the flat line of Senkou Span B from the weekly chart. Initially, the line was rejected, so you can expect a correction towards the defeated support zone. This place can be used to look for a position consistent with the trend.
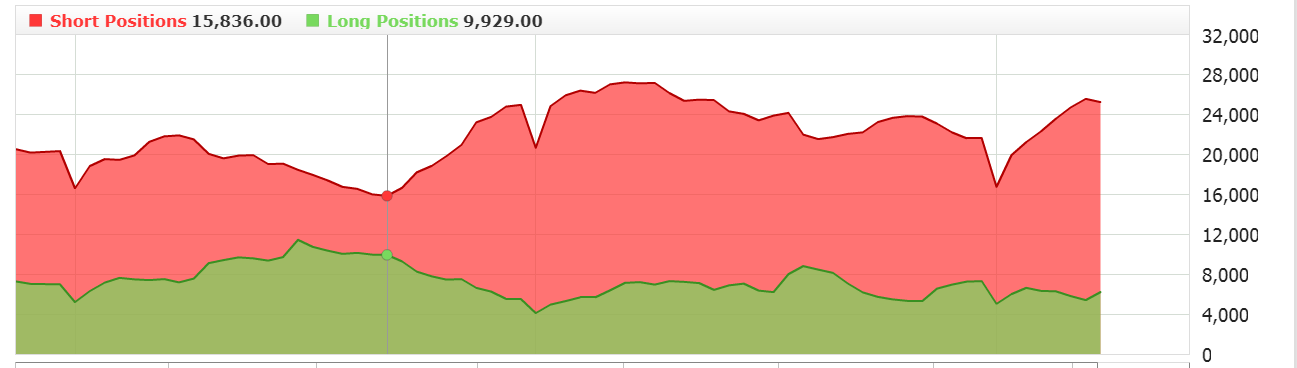 Provided that the attitude of the players changes, because now all upward movement was used to occupy or average short positions. Actually we are far away from a potential setup, so perhaps the sentiment will change until then.
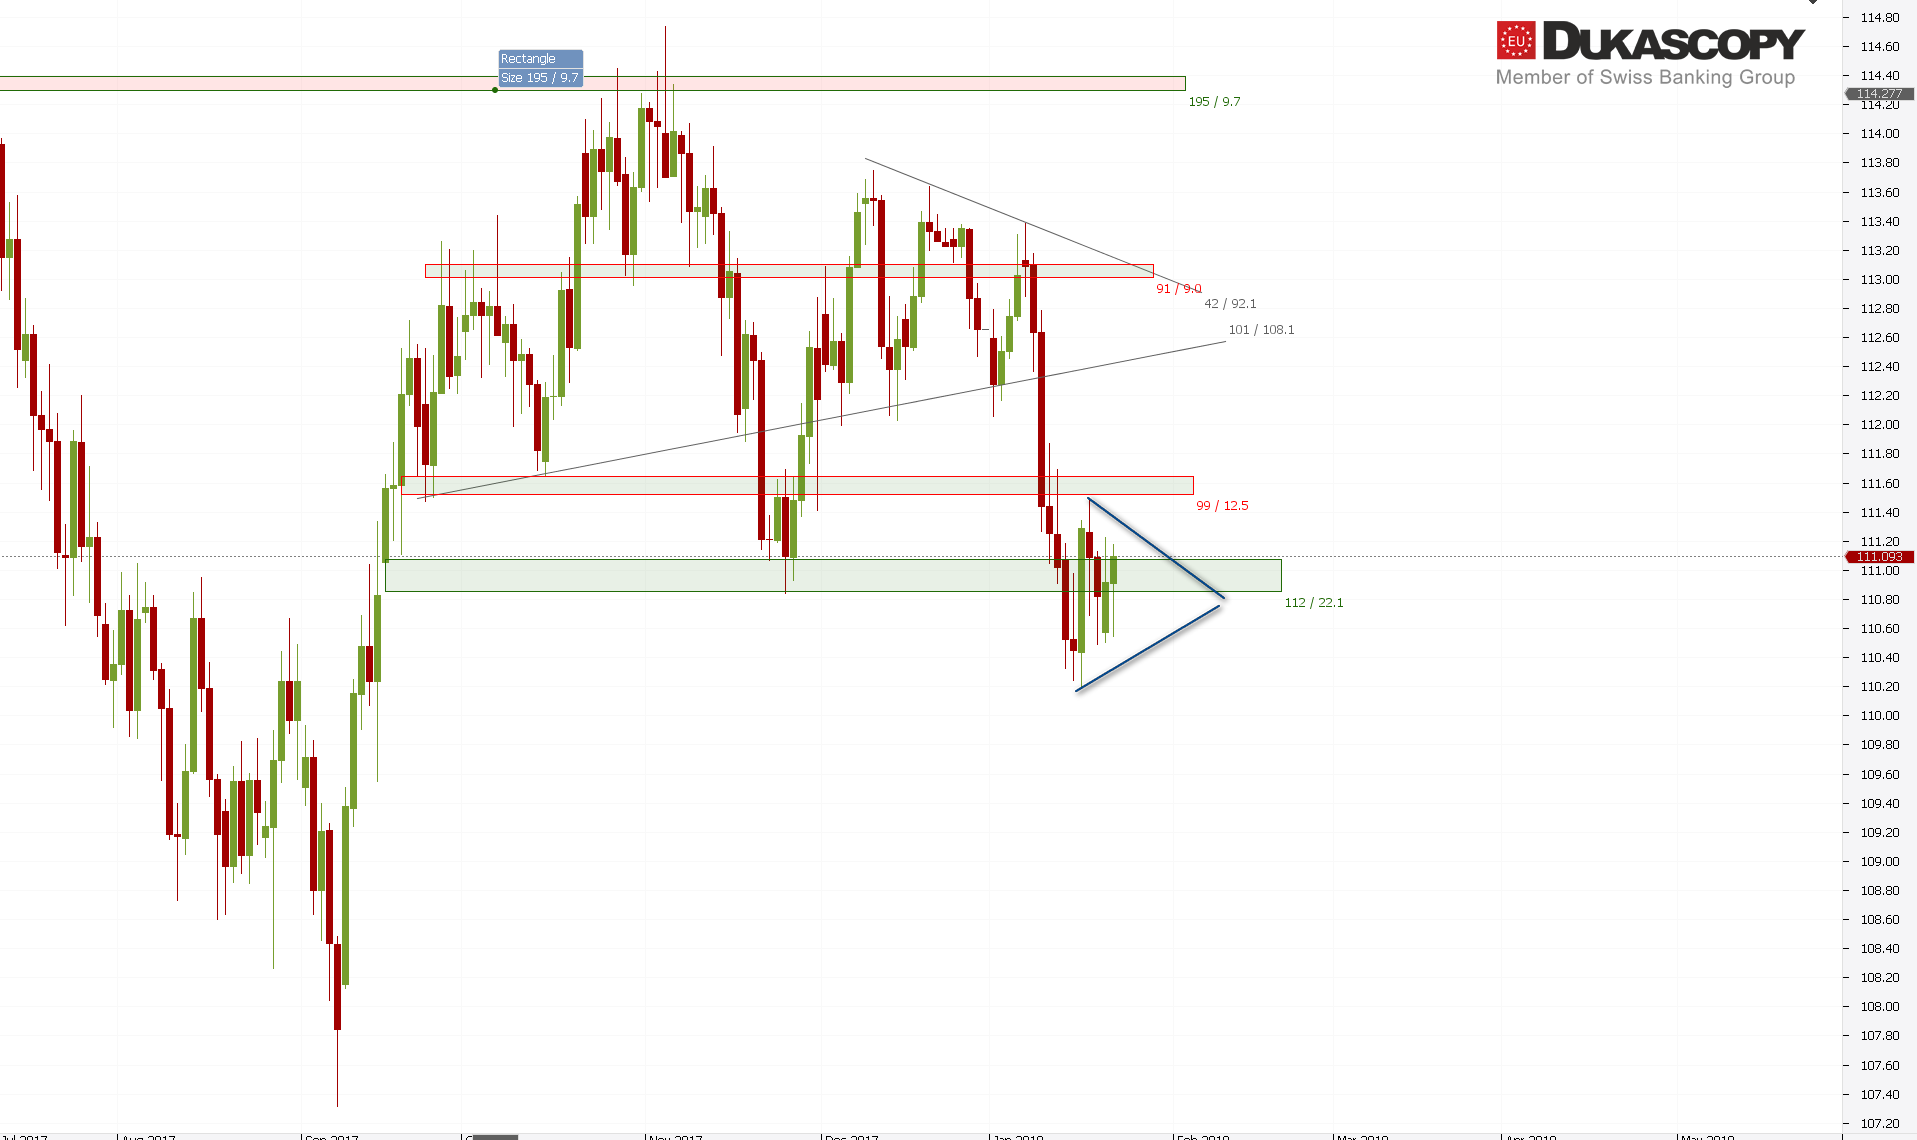 The USD/JPY is still between two levels. Right above, there is a resistance line from the weekly chart and the Kijun flat line. If the pair can not cope with this level, we should see continuation of the decreases and at least the completion of the simple correction ABC. Deepening the movement under the last low can mean a third wave and move towards the low from last year.
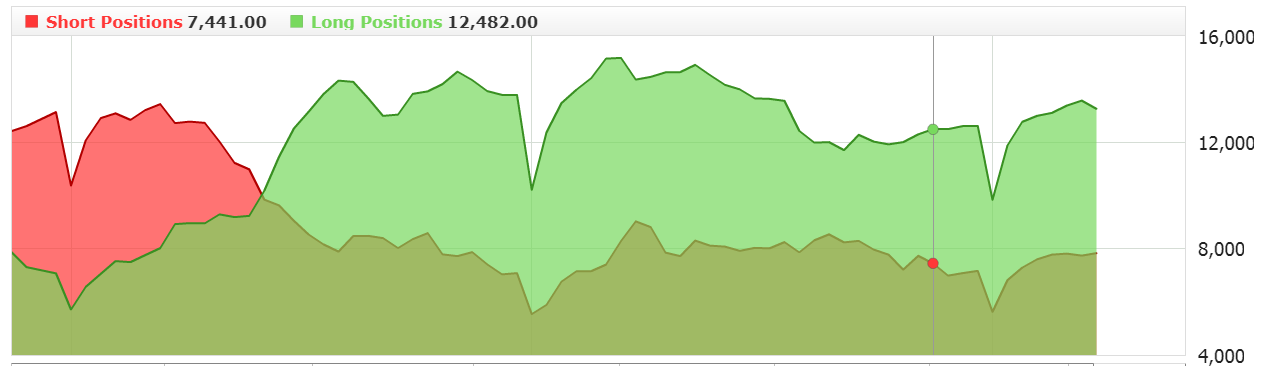 The sentiment stays neutral and you can look for any position. Because I use Ichimoku to take positions, the direction is determined by the indicator. However, it is still far to the entrance. The pair on the daily chart slowly passes over the Tenkan line, which changes direction to the horizontal, which indicates a larger correction.


 Review")


