 “Search, Analyse, Trade” is a series of Price Action and Elliott Waves analyses. Its detailed step-by-step description can be found over here. I invite you to today’s review of selected currency pairs and potential trading opportunities. The analyses are based on the Dukascopy sentiment that you can get here.
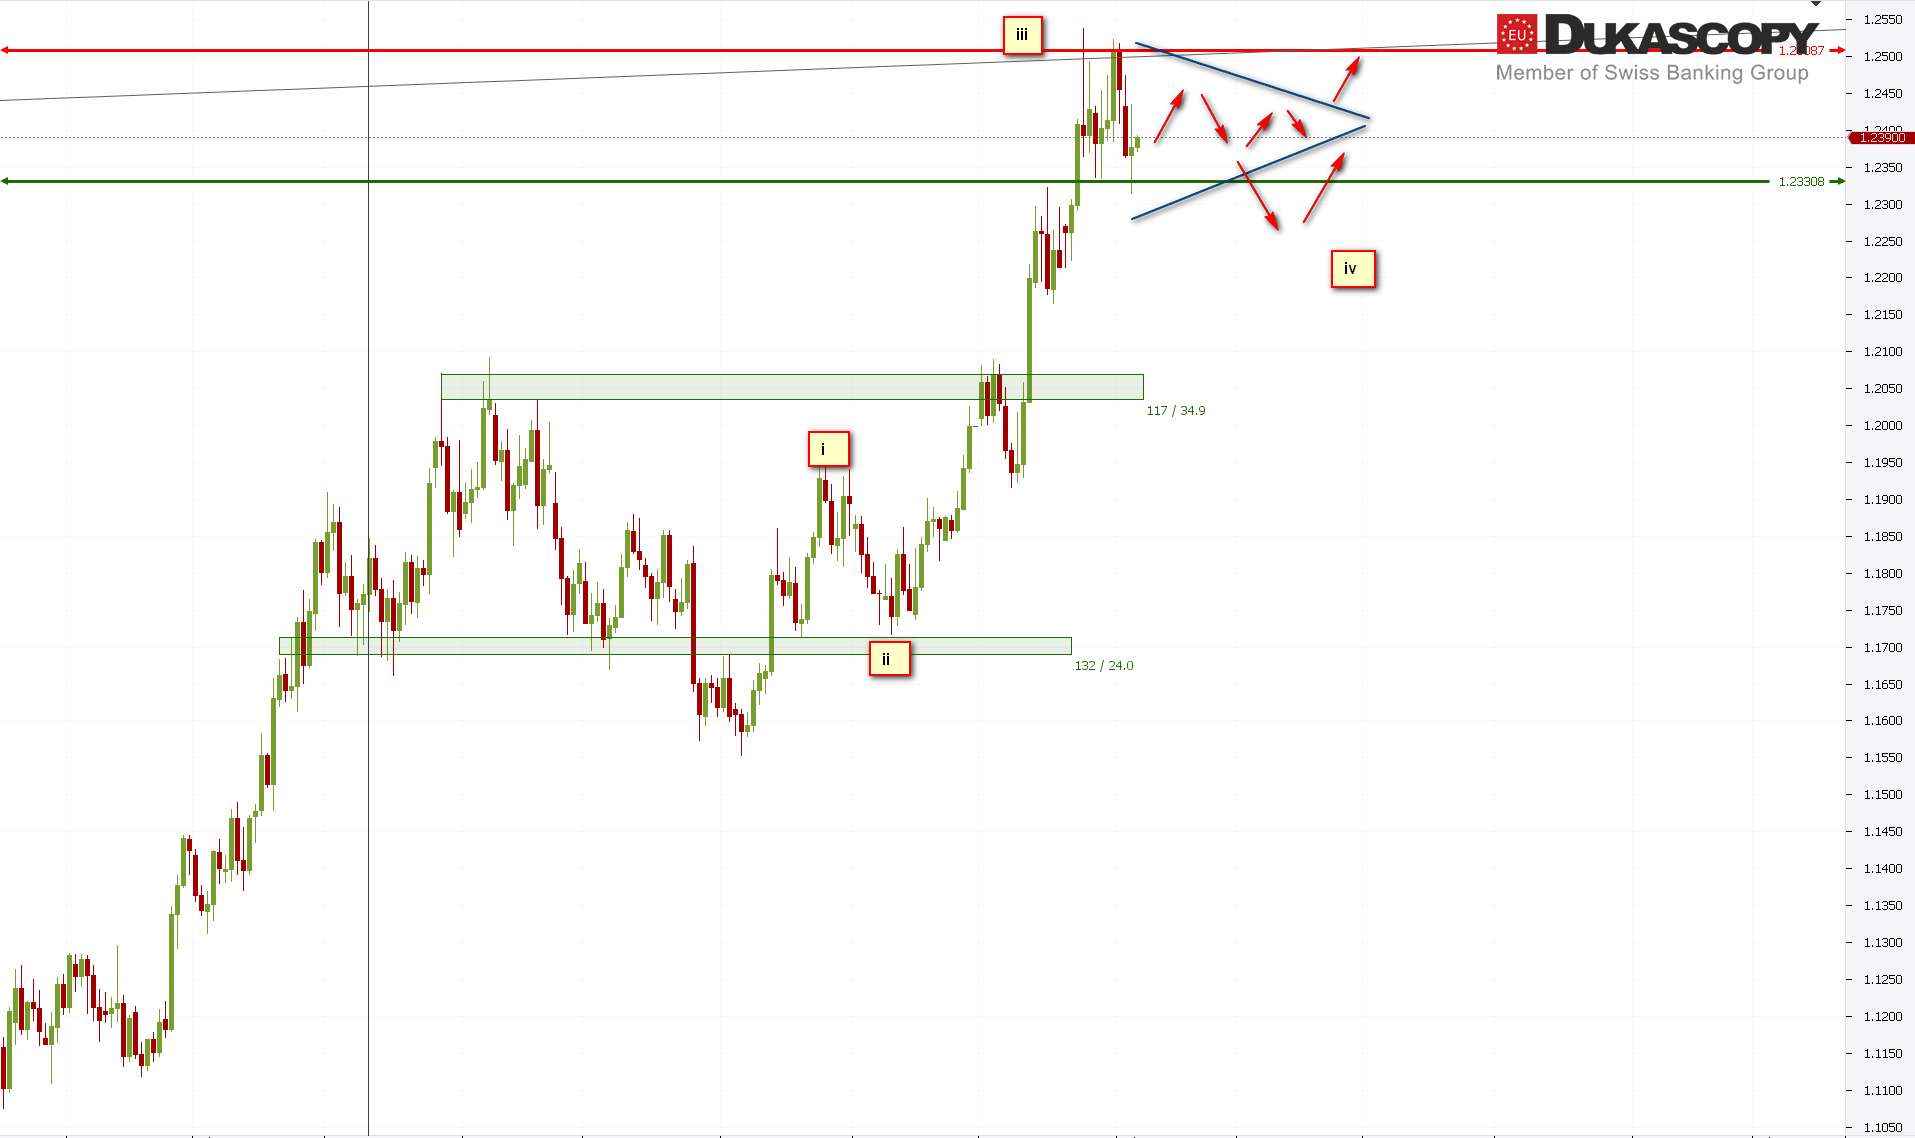
EUR/USD pair remains in correction of the recent increase. The pair reached support zone yesterday and we see an attempt to defend it. From the waves point of view, the pair should be in the fourth wave of the upward wave, and the current correction may be its fourth wave. Looking at the second wave, which is a fast and simple wave, this should take a form of a straight correction stretched in time or, for example, a triangle.
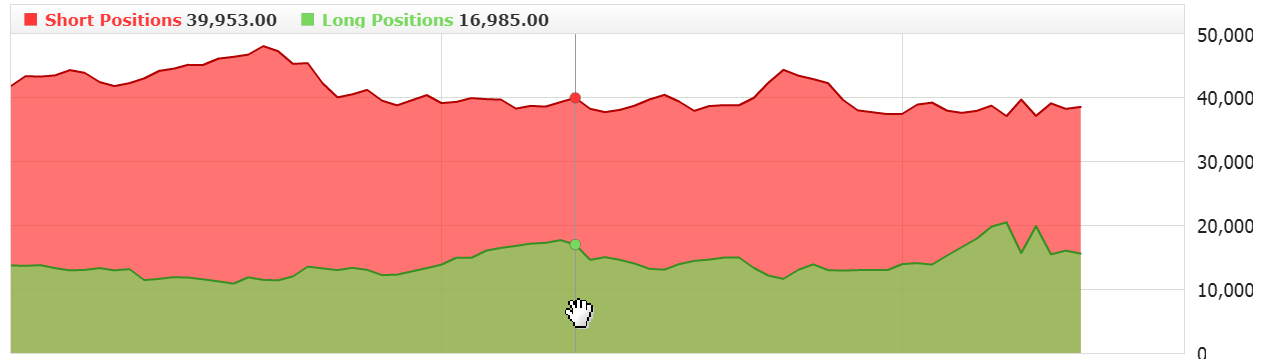 The sentiment chart, unchanged. We still have a very big advantage of short positions. Currently, no increase in any of the parties is visible, that means, the sentiment is neutral. You can look for a position consistent with the trend. If we look at the chart on H4, we will see three waves down, then three up and now five down. These five waves down, may be the beginning of a larger correction wave, but it may also be the end of the correction if the whole structure is not the fourth wave but the subwave of the third wave.
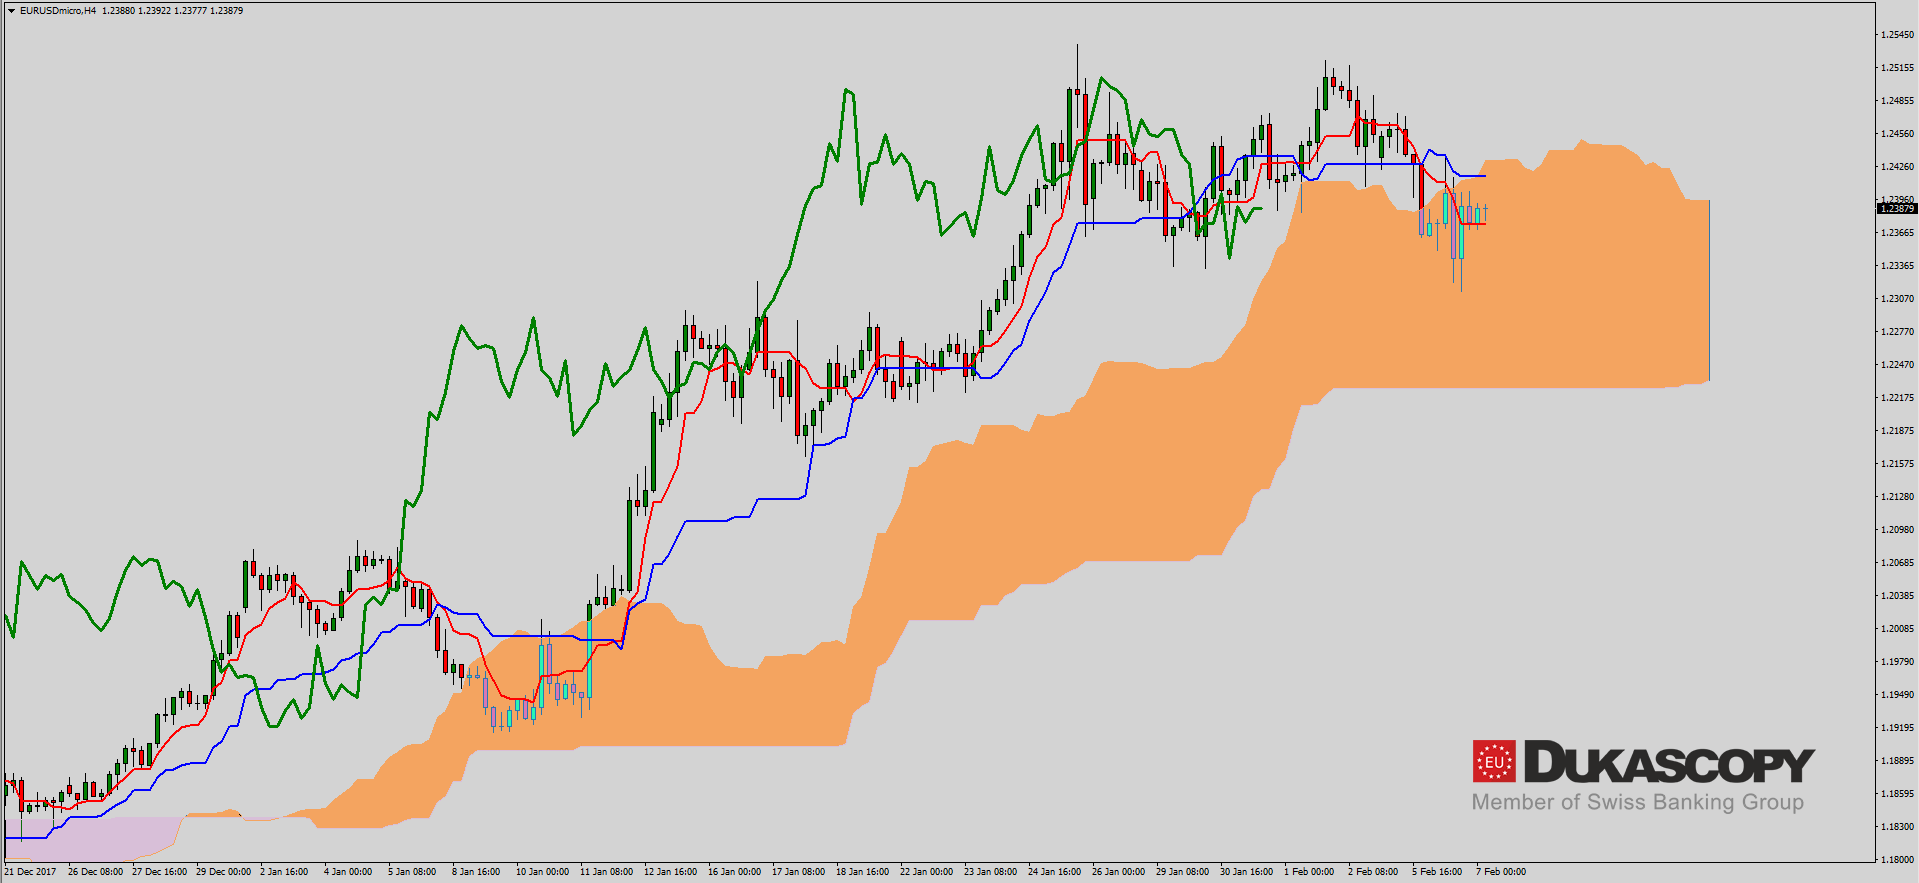 The pair is currently in a bullish cloud. The line layout is corrective. If, however, the pair will break up from the cloud, Tenakan and Kijun lines should cross and grow in size and you will be able to play for the third wave.
The partner of “Search, Analyse, Trade” series is a Dukascopy Europe broker who gives its customers access to ECN accounts in different currencies.
Trade on Forex, indices and commodities thanks to Swiss FX & CFD Marketplace. Open free trading account right now.
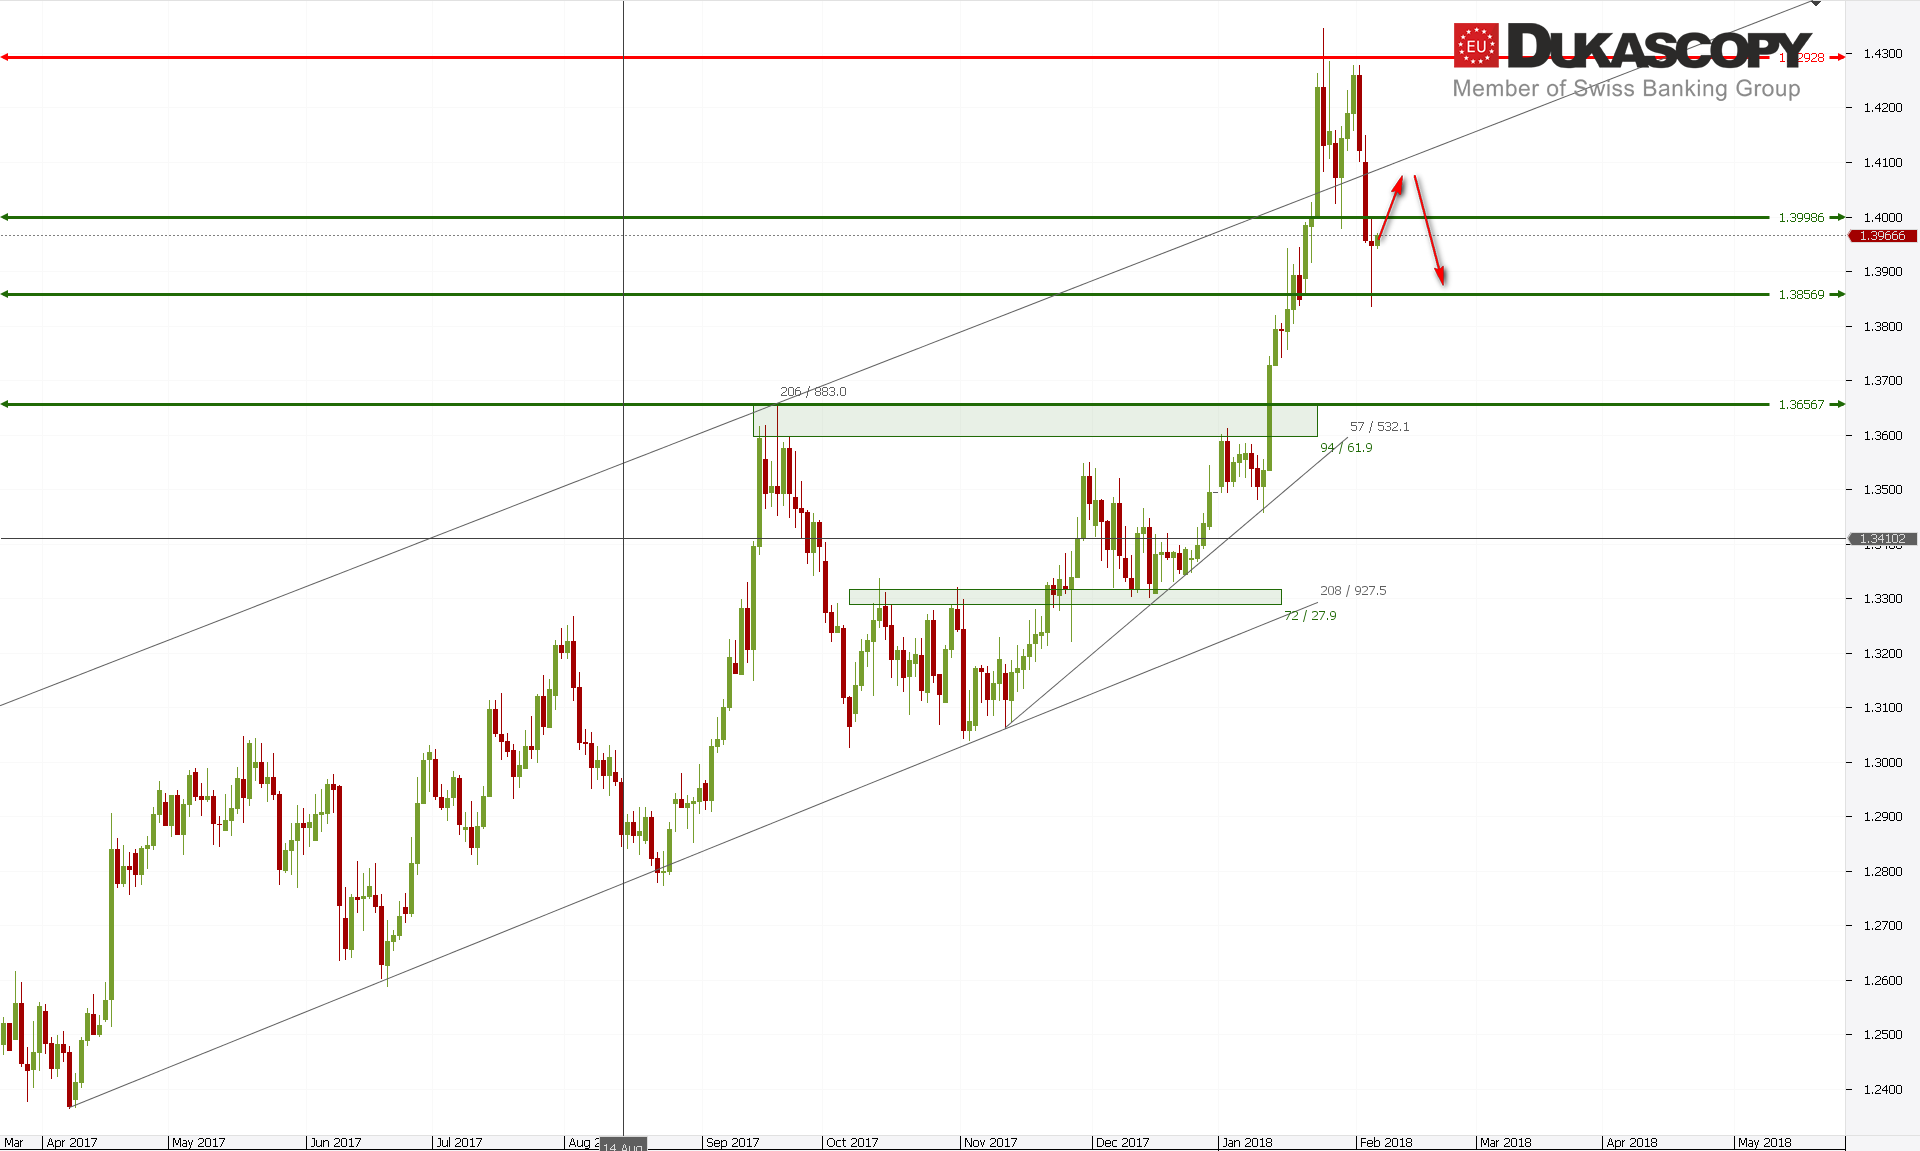
The GBP/USD arrived yesterday in the support zone. At the moment, the level has been rejected by the Pin Bar. This may suggest a desire for further growth towards the broken line streched over the tops. If the last unsuccessful attack on the high is considered the fifth wave of the recent upward wave, the current decline should be just the beginning of the correction. It may be a wave A and after correcting it we will see another towards key support.
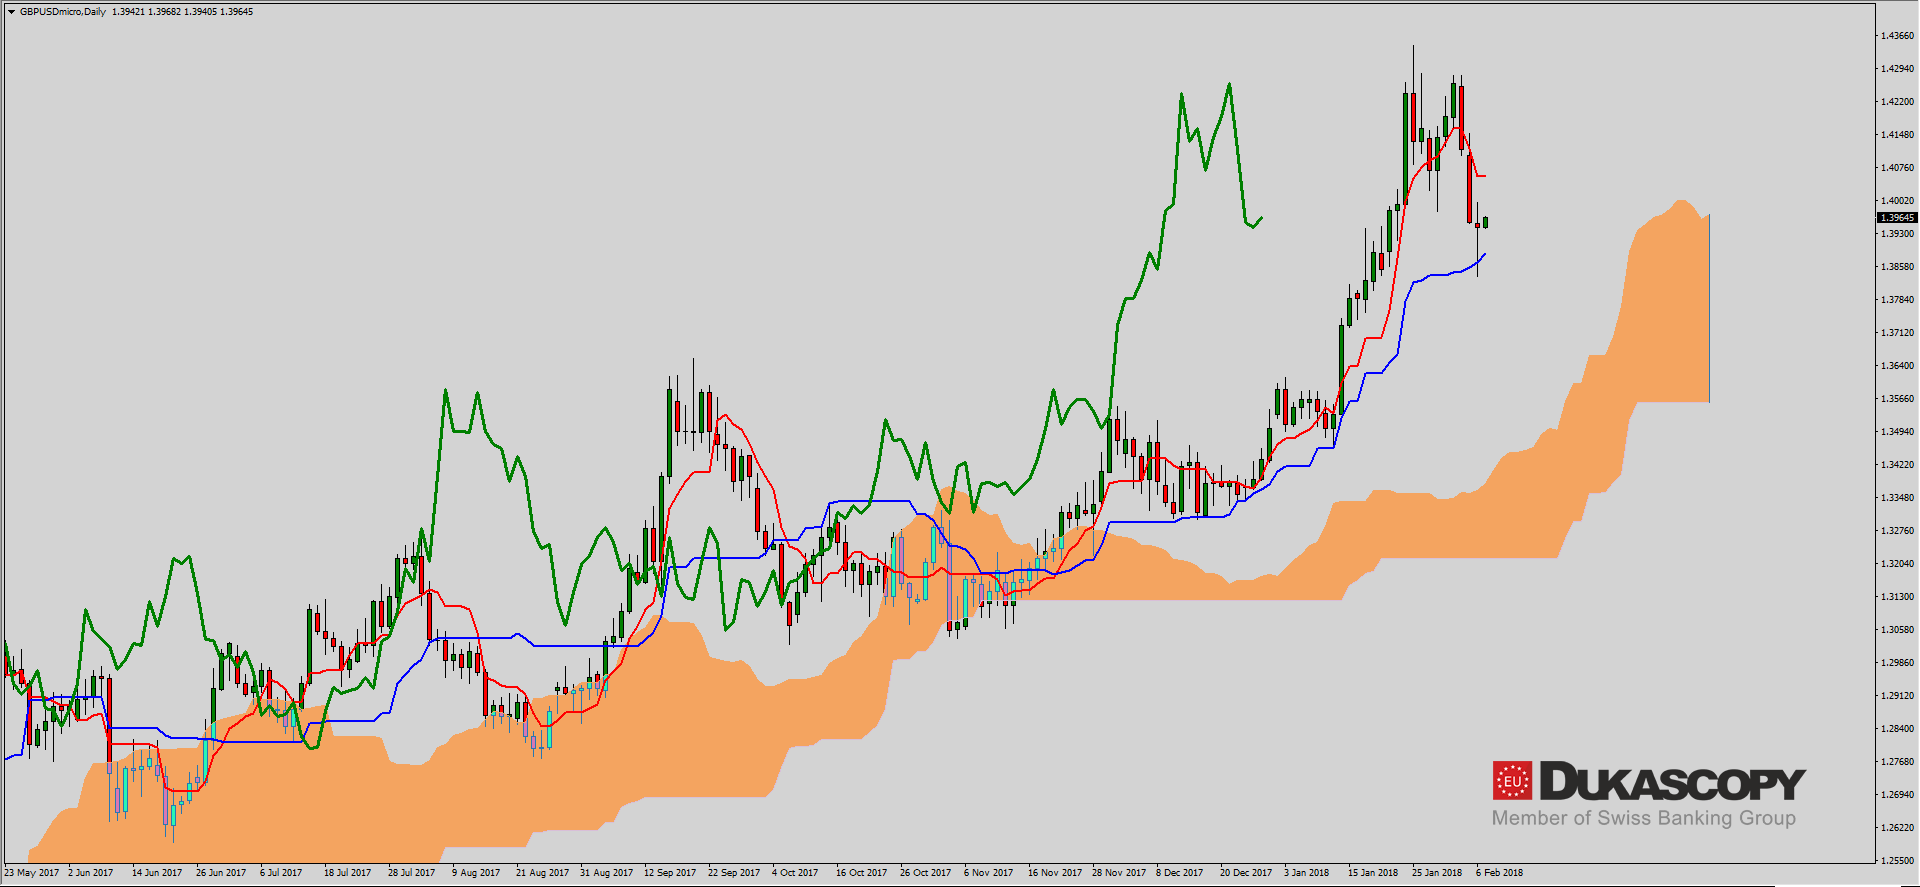
Situation can be well seen on the Ichimoku chart. The pair reached the Kijun line and rebounded from it. Until the line is maintained as a support, we should watch the sideway movement between the Kijun and Tenkan lines or attempt to attack the high again. Only the defeating of Kijun line will suggest a larger correction.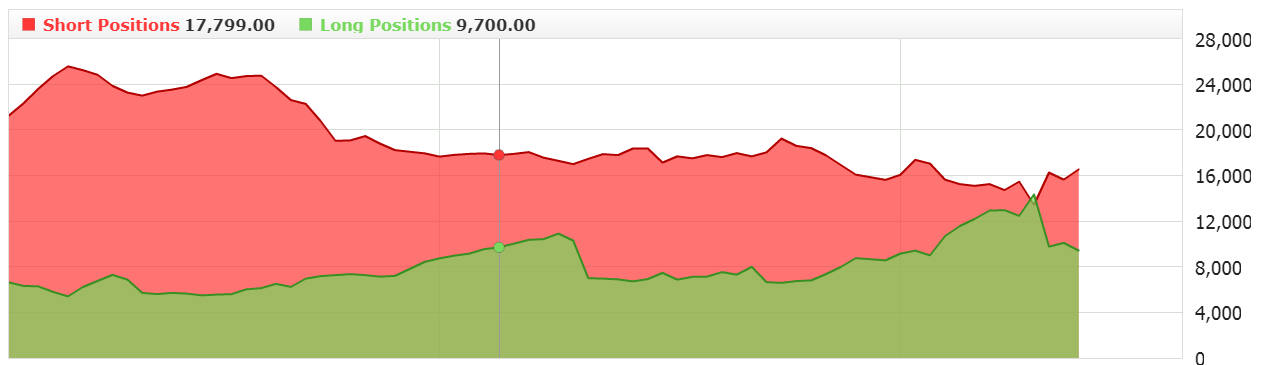
The sentiment has changed more again. Since yesterday, we have a clear increase in short positions and a reduction in long positions. This system allows us to play a short, which I can not do until price will beat the Kijun line on the daily chart, and I stay on the side.
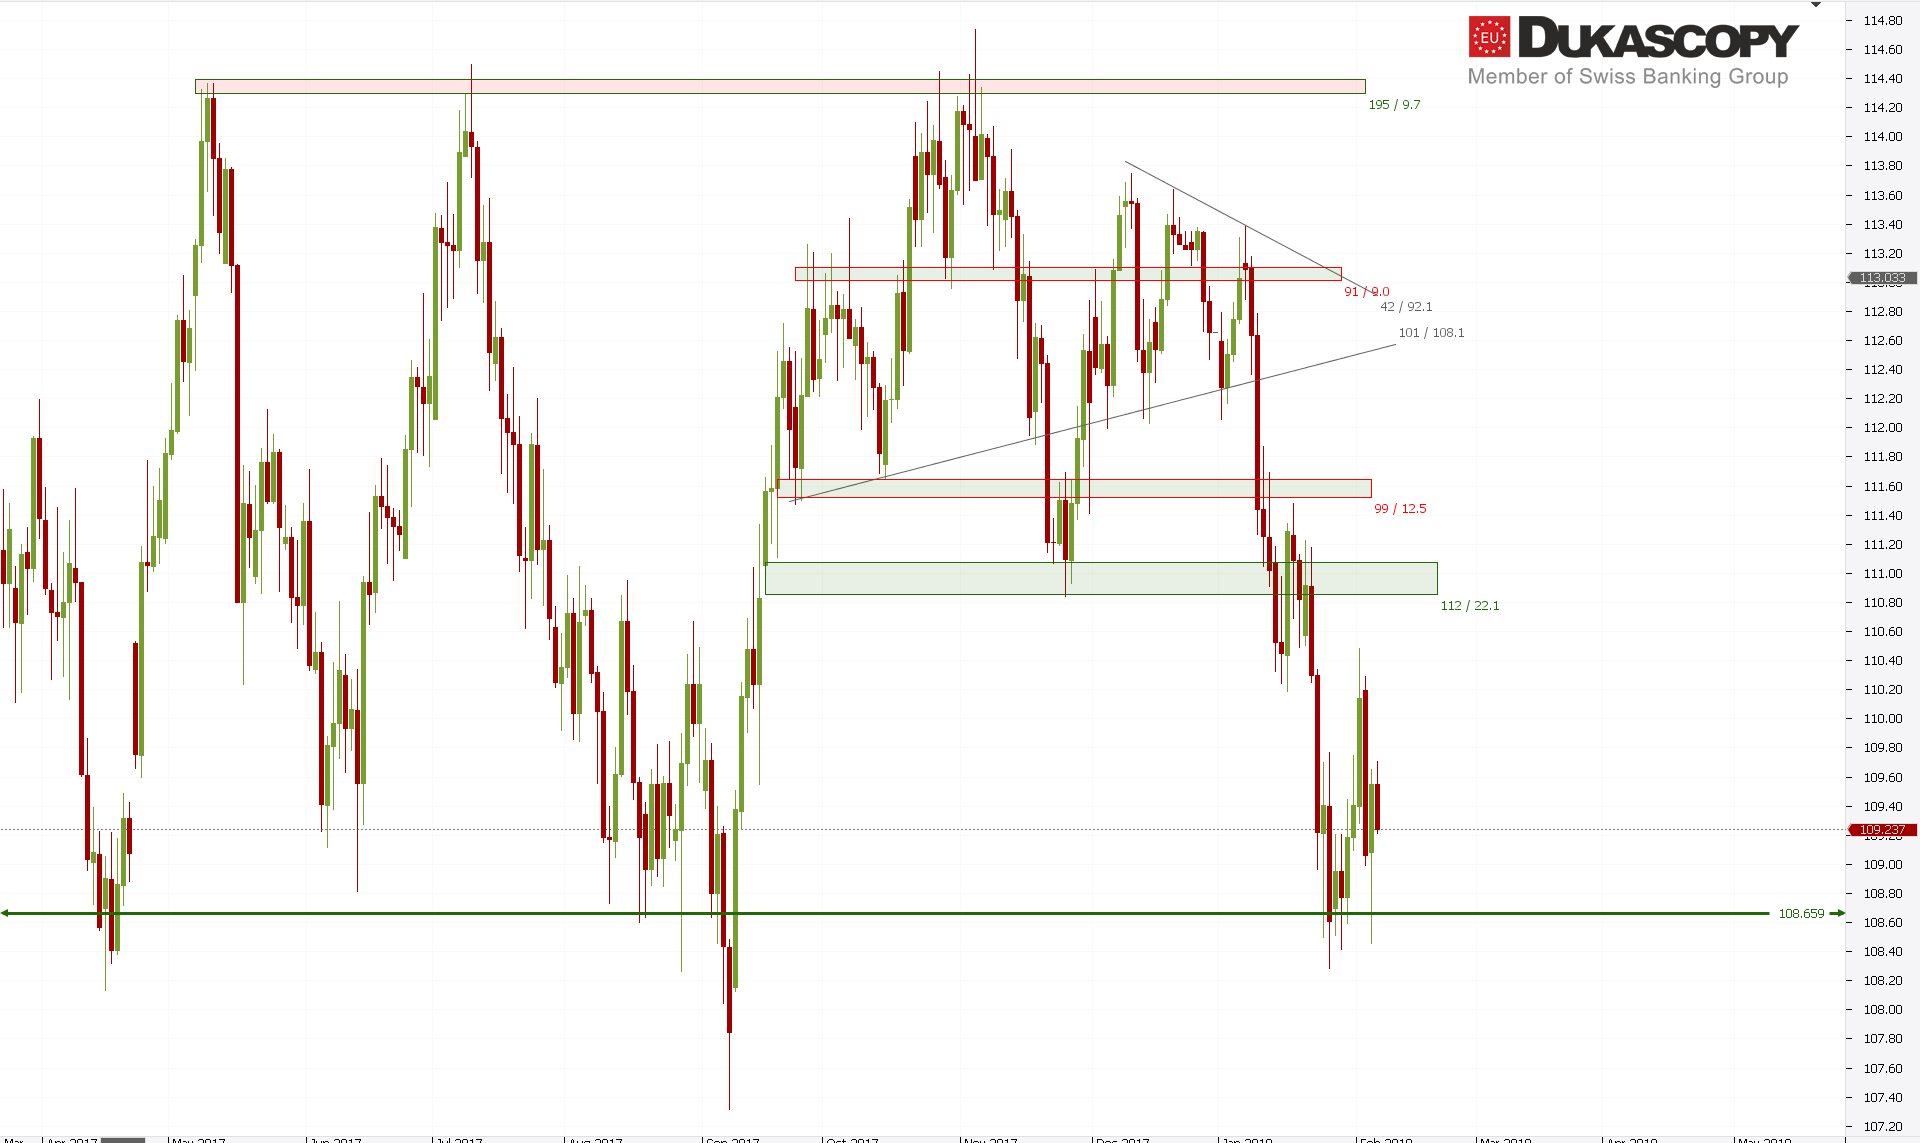 The USD/JPY is in balance in the support zone. There is not much going on recently with this pair and we can move sideways until the battle is resolved by this level. The last candle defending the zone is strongly bullish, which could suggest an attempt to continue the move, but the next one is definitely bearish.
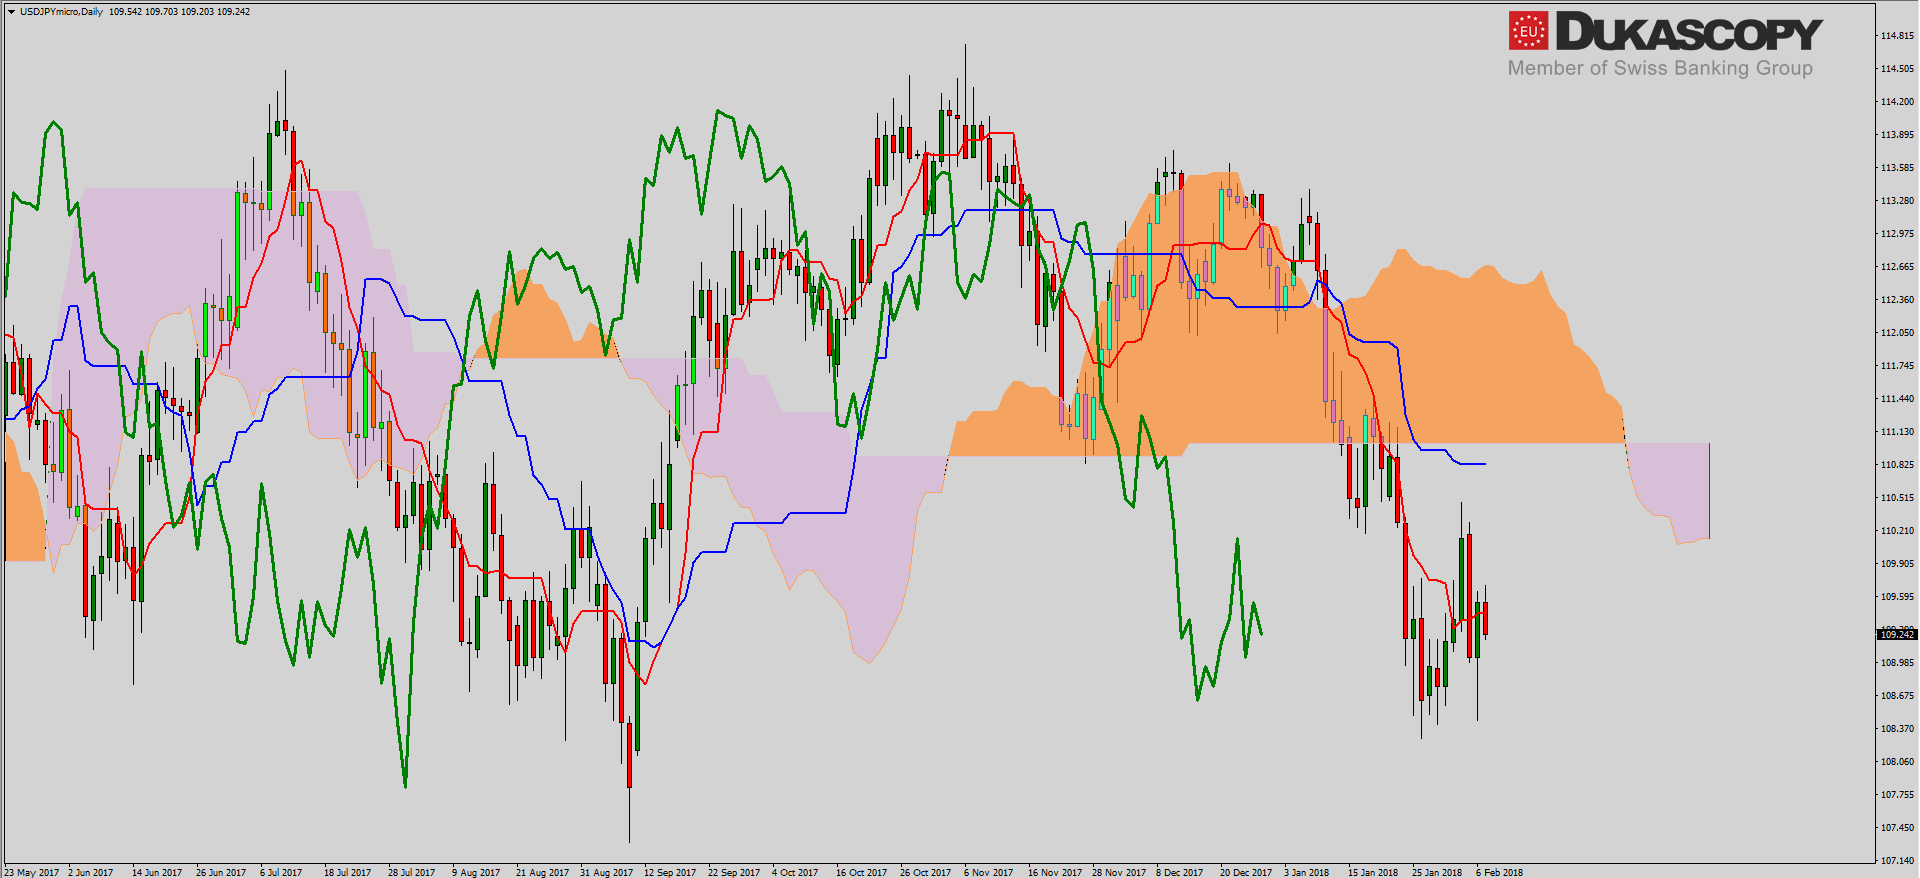
On the Ichimoku graph, the layout is typical for consolidation movement. The pair oscillates around a flat Tenkan line and the Kijun line, which is quite a bit away from the price, also starts to run sideways.
 The sentiment remains unchanged. You can open positions in any direction, but current moves do not encourage us to do it, so I stay on side until the dispute over support is resolved.


 Review")


