“Search, Analyse, Trade” is a series of Price Action and Elliott Waves analyses. Its detailed step-by-step description can be found over here. I invite you to today’s review of selected currency pairs and potential trading opportunities. The analyses are based on the Dukascopy sentiment that you can get here.

EUR/USD continues declines initiated by the rejection of the line drawn over last highs. If the pair reaches the support zone in the form of the last low, then the movement we watched after her defence two weeks ago will have to be considered as the C wave of the irregular correction. And this will mean the ending of wave B in straight line correction and continuation of declines towards the key support zone based on 3C wave. The re-defence of the zone will prolong the consolidation in time and we will need to wait for the next upward wave in the B-wave of higher order.
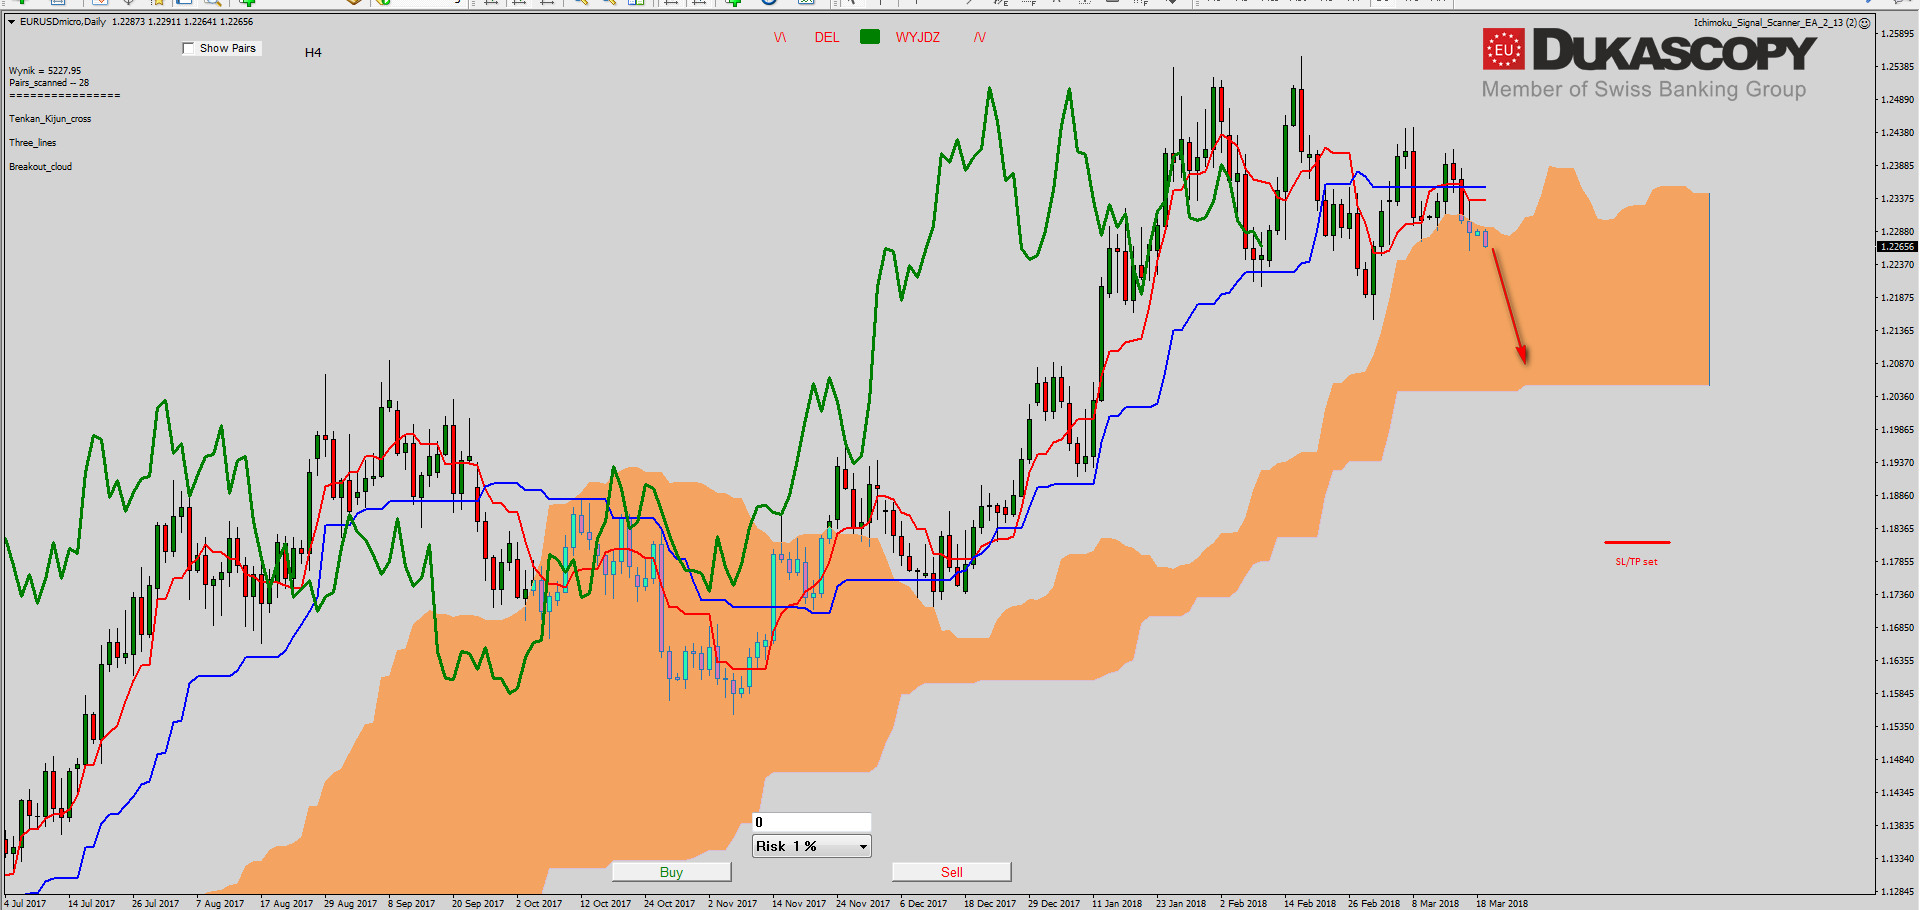 On the Ichimoku chart, we see that the pair has fallen below Senkou Span A. At the same time, Kijun and Tenkan lines have crossed forming a cross. However, the arrangement of averages is typical for a consolidation. Both lines move flat and do not define the direction. The Chikou line remains in the price between Tenkan and Kijun. If the pair moves more to the south, it is quite possible that it will reach the flat Senkou Span B, which can attract the price to itself.
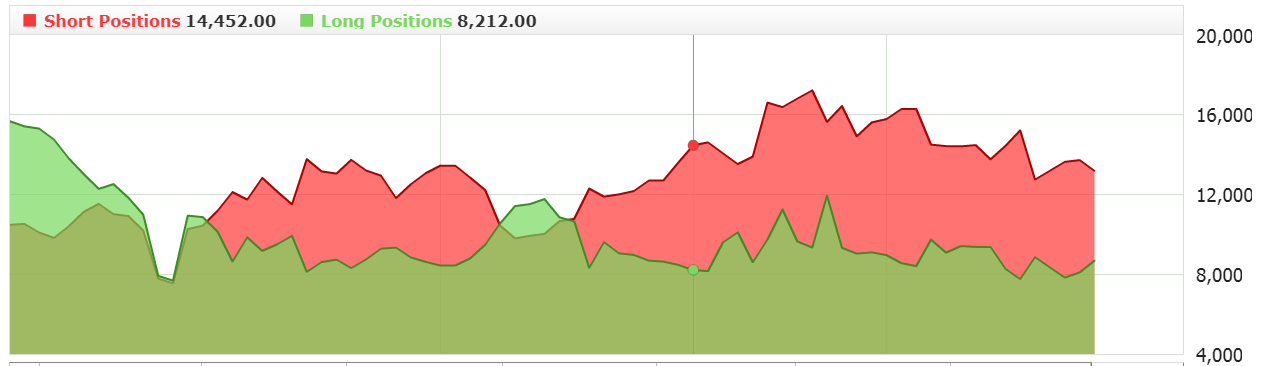
 Sentiment becomes more and more bullish. We are seeing a rise in long positions since Friday. Players count on the defence of the last low and the continuation of the trend. Its far away for a signal to occur so only observation is left.
The partner of “Search, Analyse, Trade” series is a Dukascopy Europe broker who gives its customers access to ECN accounts in different currencies.
Trade on Forex, indices and commodities thanks to Swiss FX & CFD Marketplace. Open free trading account right now.
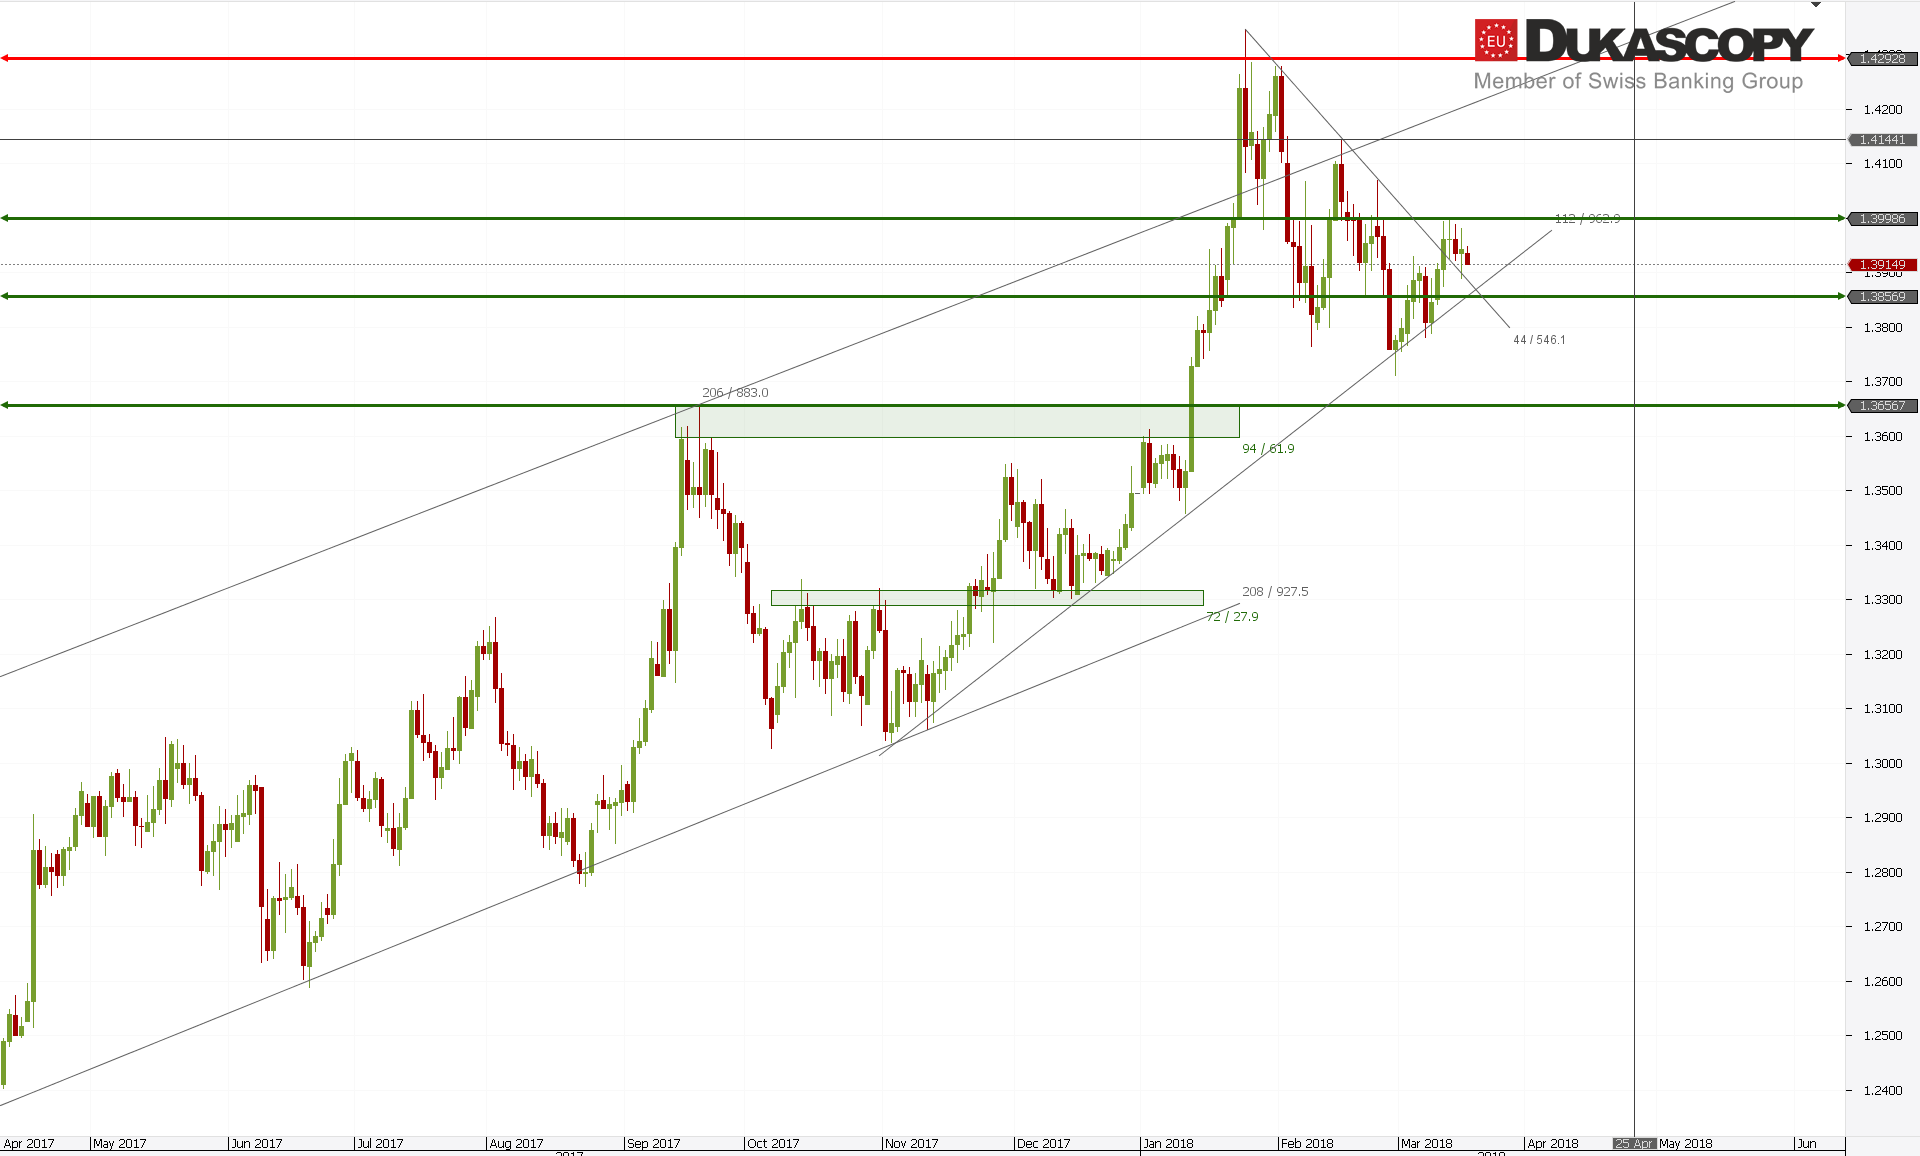 GBP/USD remains above the line extended over the tops. The pair, however, rejected internal resistance and headed towards it. We should see her re-test today. If the pair manages to reject it, the upward movement has a chance to continue. Otherwise, the pair will test the accelerated trend line and there should decide in which direction it will go in the near future. Both scenarios are equally likely, so it remains to wait.
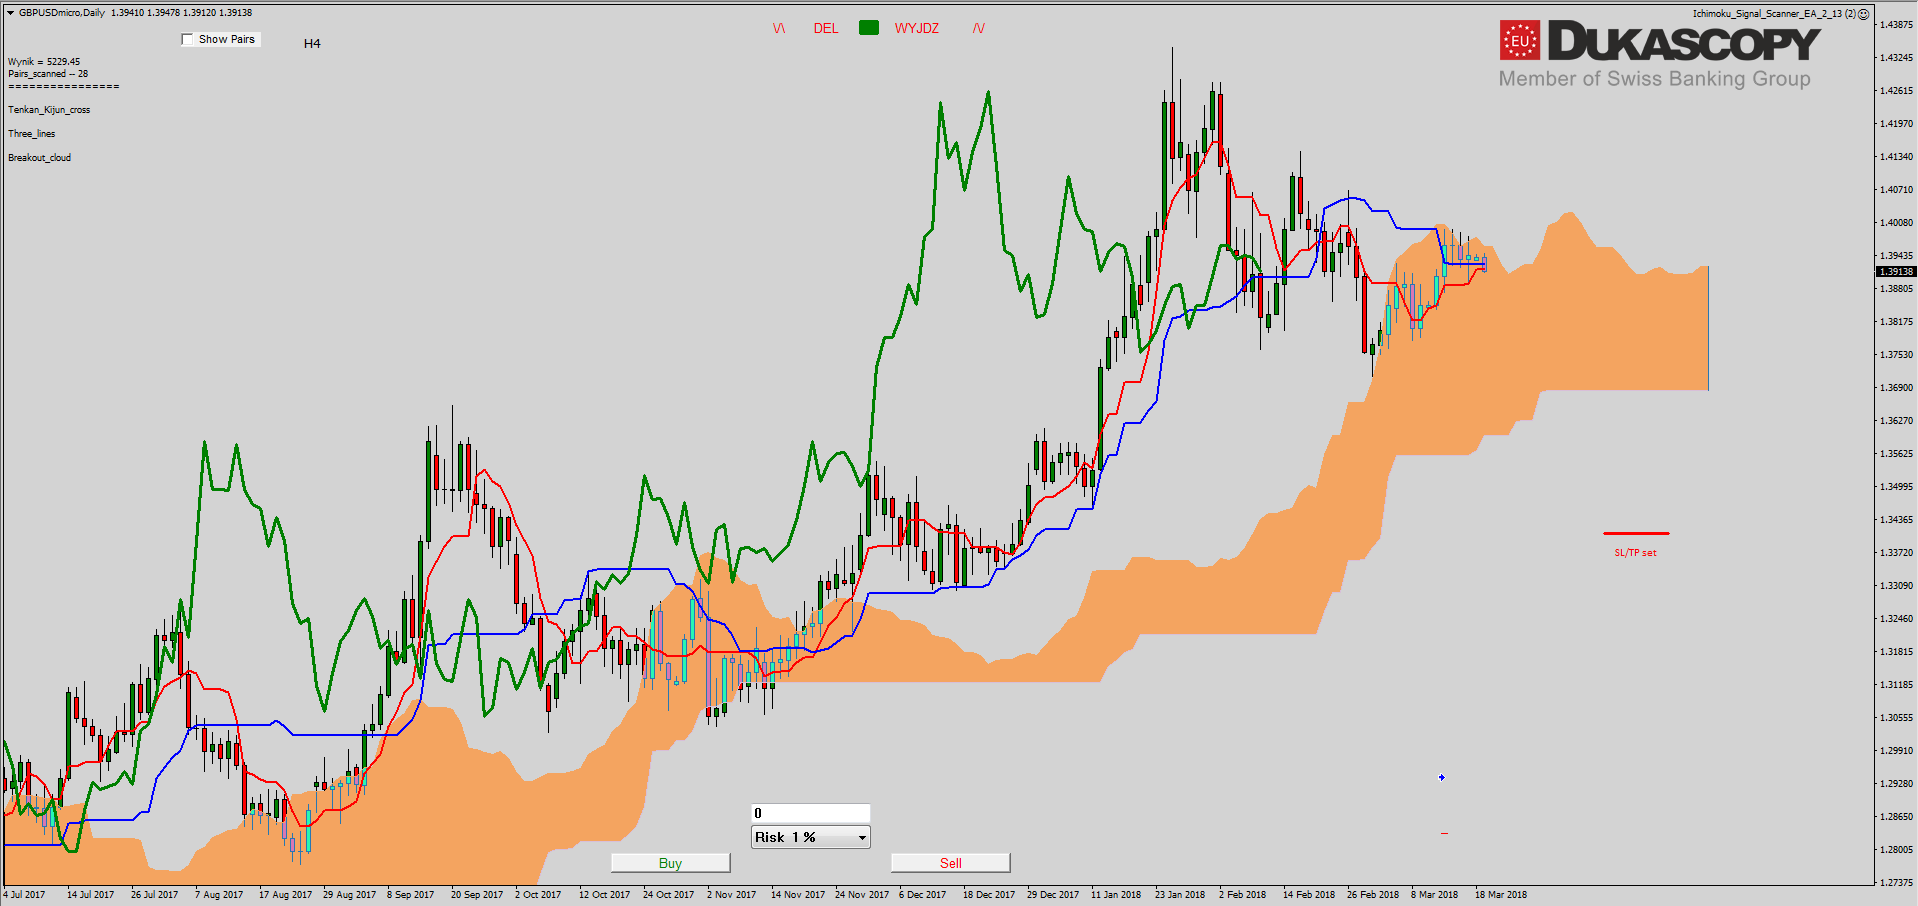
 On the Ichimoku chart, the pair stays in the cloud and balances right on the Tenkan and Kijun lines. The lines are close to the intersection due to Tenkan, which is starting to move up. Kijun remains flat. The Chikou line has reached Kijun, which may work as support. The sentiment remains neutral and you can try to look for a position. On the H4 graph it is very close to a growth signal. The pair is on the Senkou Span B line and just above the support on the last high. A stronger upward movement should give a signal to open the position.
 USD/JPY continues downward movement after rejecting the key resistance zone. The last five described by me may become the first. If this is the case and the pair does not form a finishing triangle, then in the near future we will see a test of the key support zone and its defeat based on the third wave.

On the Ichimoku chart everything leads to a downward trend. After defeating Tenkan line, one could expect a move towards the distant Tenkan line. The pair, however, turned back halfway and now is again under Tenkan, which remains flat for now. Kijun line is slowly approaching her. If the Tenkan line does not move south, such a meeting may result in longer consolidation and lateral movement.
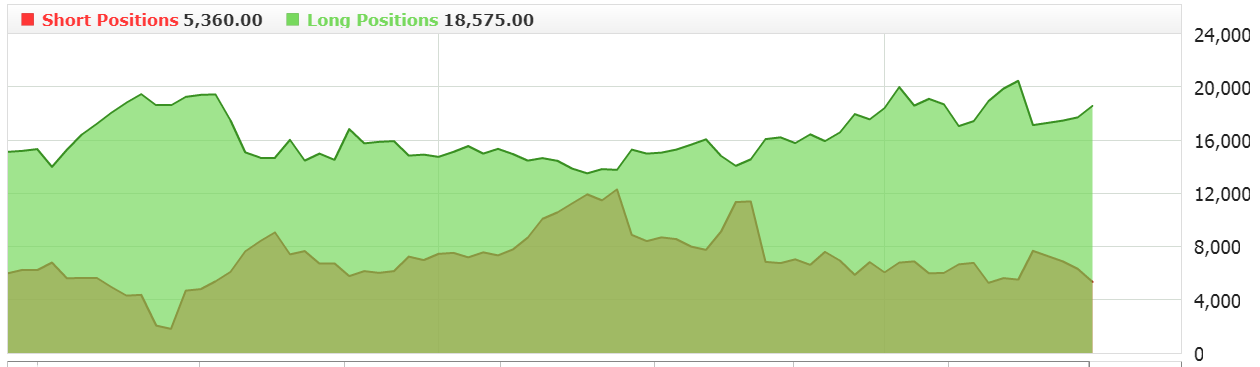
A typical sentiment for this pair. Longs still have a huge advantage, which unfortunately does not allow you to open a short position.


 Review")


