“Search, Analyse, Trade” is a series of Price Action and Elliott Waves analyses. Its detailed step-by-step description can be found over here. I invite you to today’s review of selected currency pairs and potential trading opportunities. The analyses are based on the Dukascopy sentiment that you can get here.
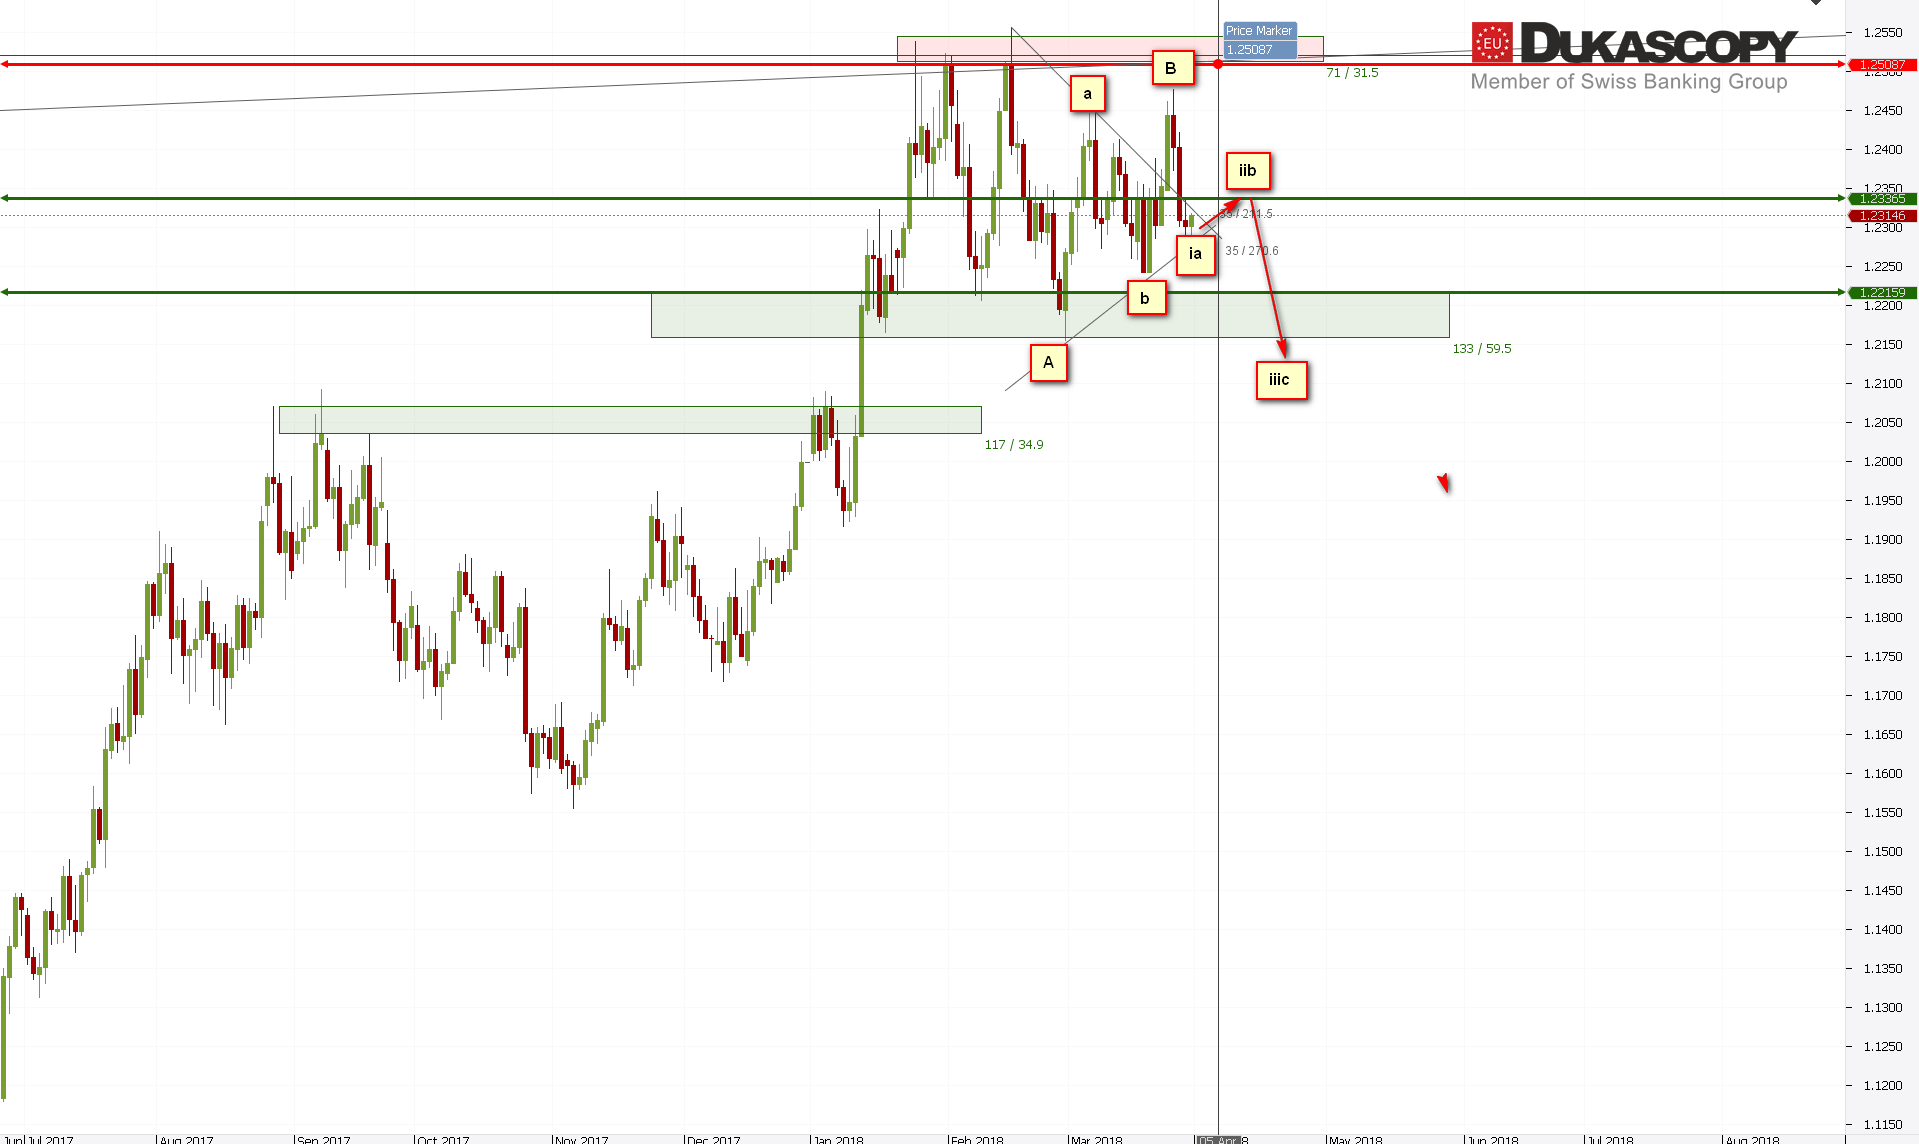
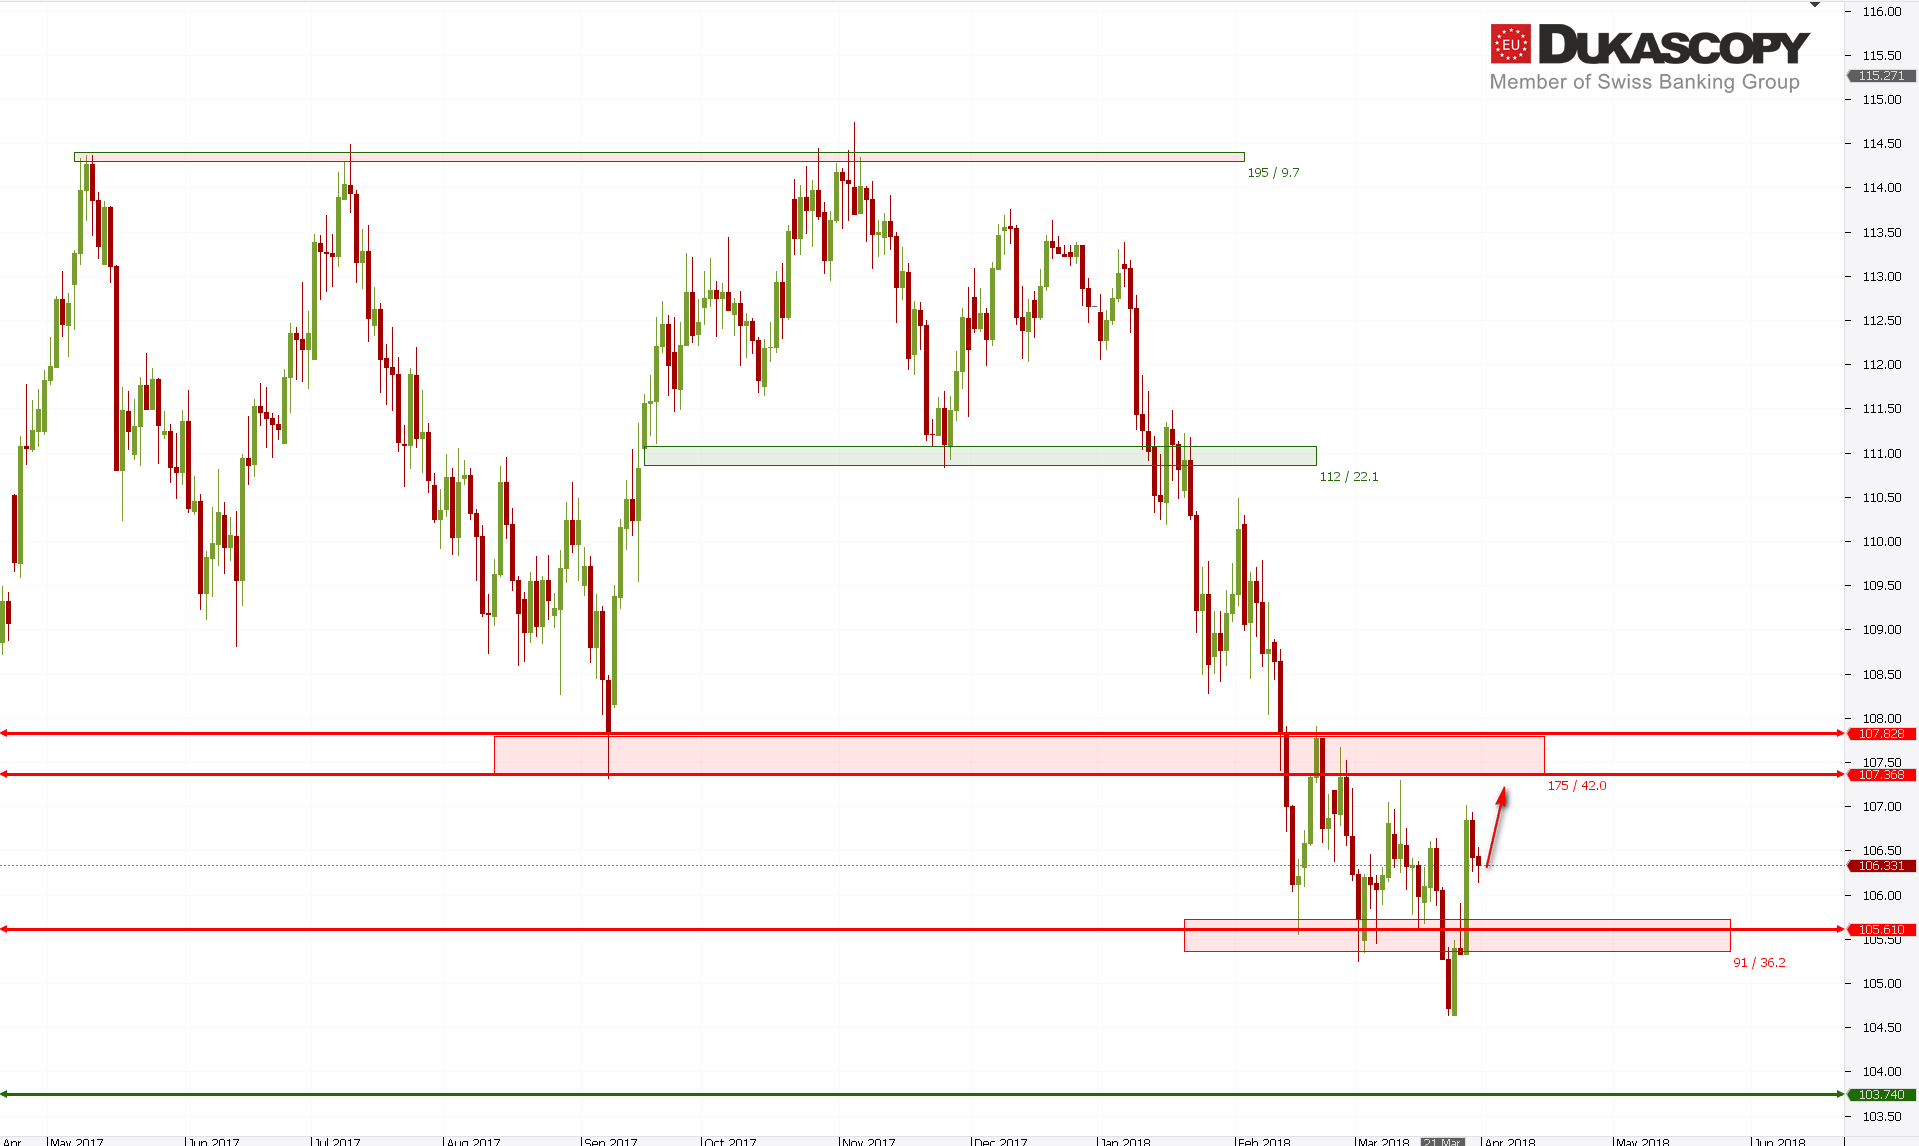
Nothing changed since yesterday on EUR/USD. The pair still remains under the internal S / R line and the upper limit of prior consolidation. Yesterday I wrote that one of the scenarios is the one with the layout 1212, i.e. pro-growth. It seems, however, that we will have to forget it. The declines after unsuccessful breaking up has become the fifth, which may mean that another bearish wave in 3C wave will await us.
 On the Ichimoku chart we also see no major changes. The pair is still in the cloud just below the Kijun line, which is currently being tested. If we assume that the decline that we have been observing for several days is the fifth, the pair should once again test the area around the Tenkan and Senkou Span A lines. The stronger rejection will confirm that continuation of declines may occur.
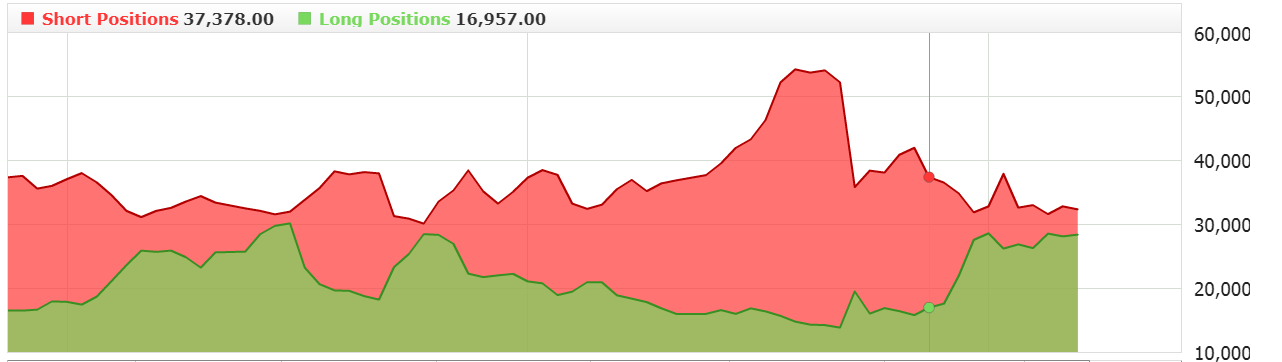 The sentiment, which shows increase in long positions, does not allow me to play under such a scenario, but by omitting it as a filter I will look for a position on H4 after correction and Ichimoku signal.
The partner of “Search, Analyse, Trade” series is a Dukascopy Europe broker who gives its customers access to ECN accounts in different currencies.
Trade on Forex, indices and commodities thanks to Swiss FX & CFD Marketplace. Open free trading account right now.
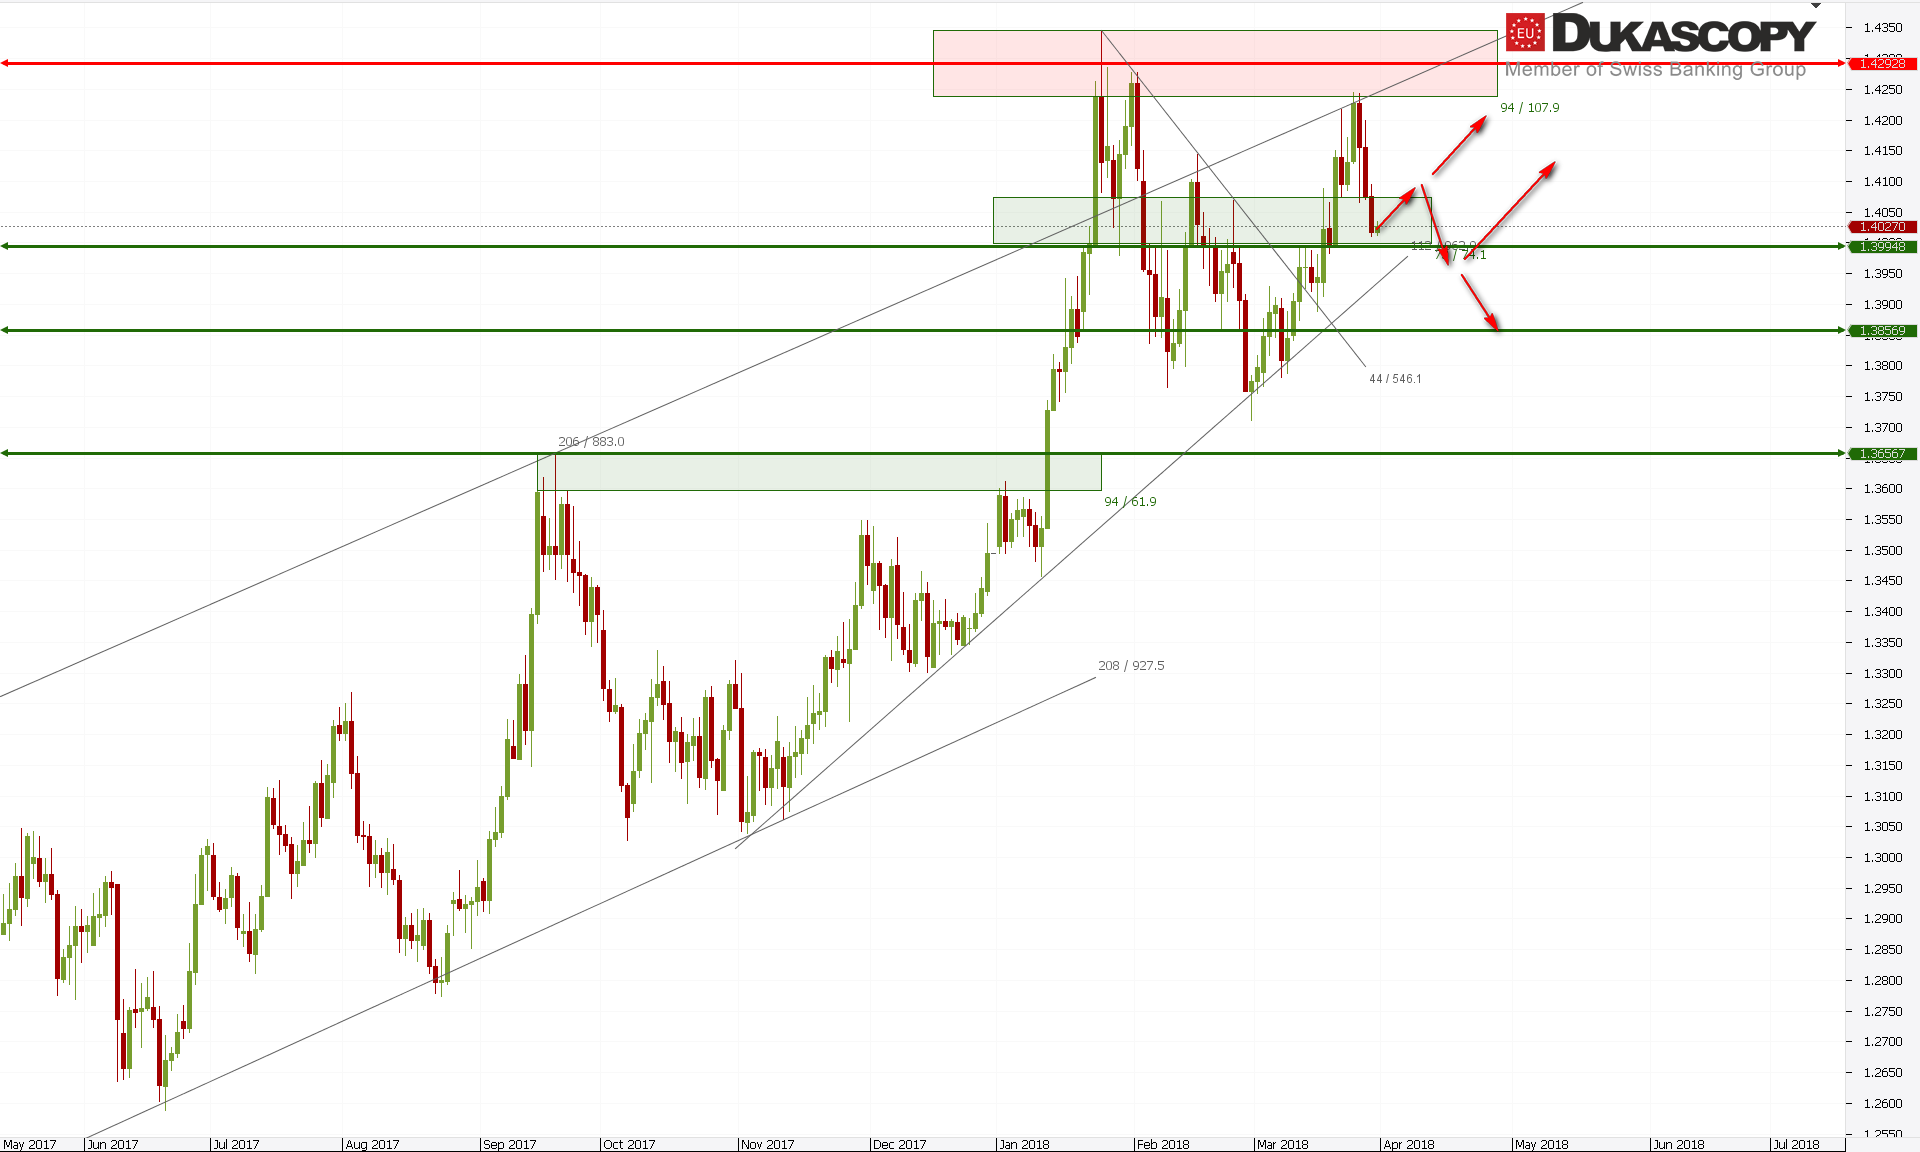 The scenario in which the currently watched drop is sub-wave 4 of the last upward trend will rather be not fulfilled. The pair dropped too low and is currently testing the lower limit of the support zone. If demand appears on these levels, then we should see increases in the B wave in the correction of the entire impulse. After them, a downward wave C should appear. I assume all the time that the increase from the last low is the first wave of continuation of the trend. However, if it is the fifth broken wave of the entire system that was created from November last year, the C wave should turn into the third wave. In this case, we will see a decline towards the key support zone.
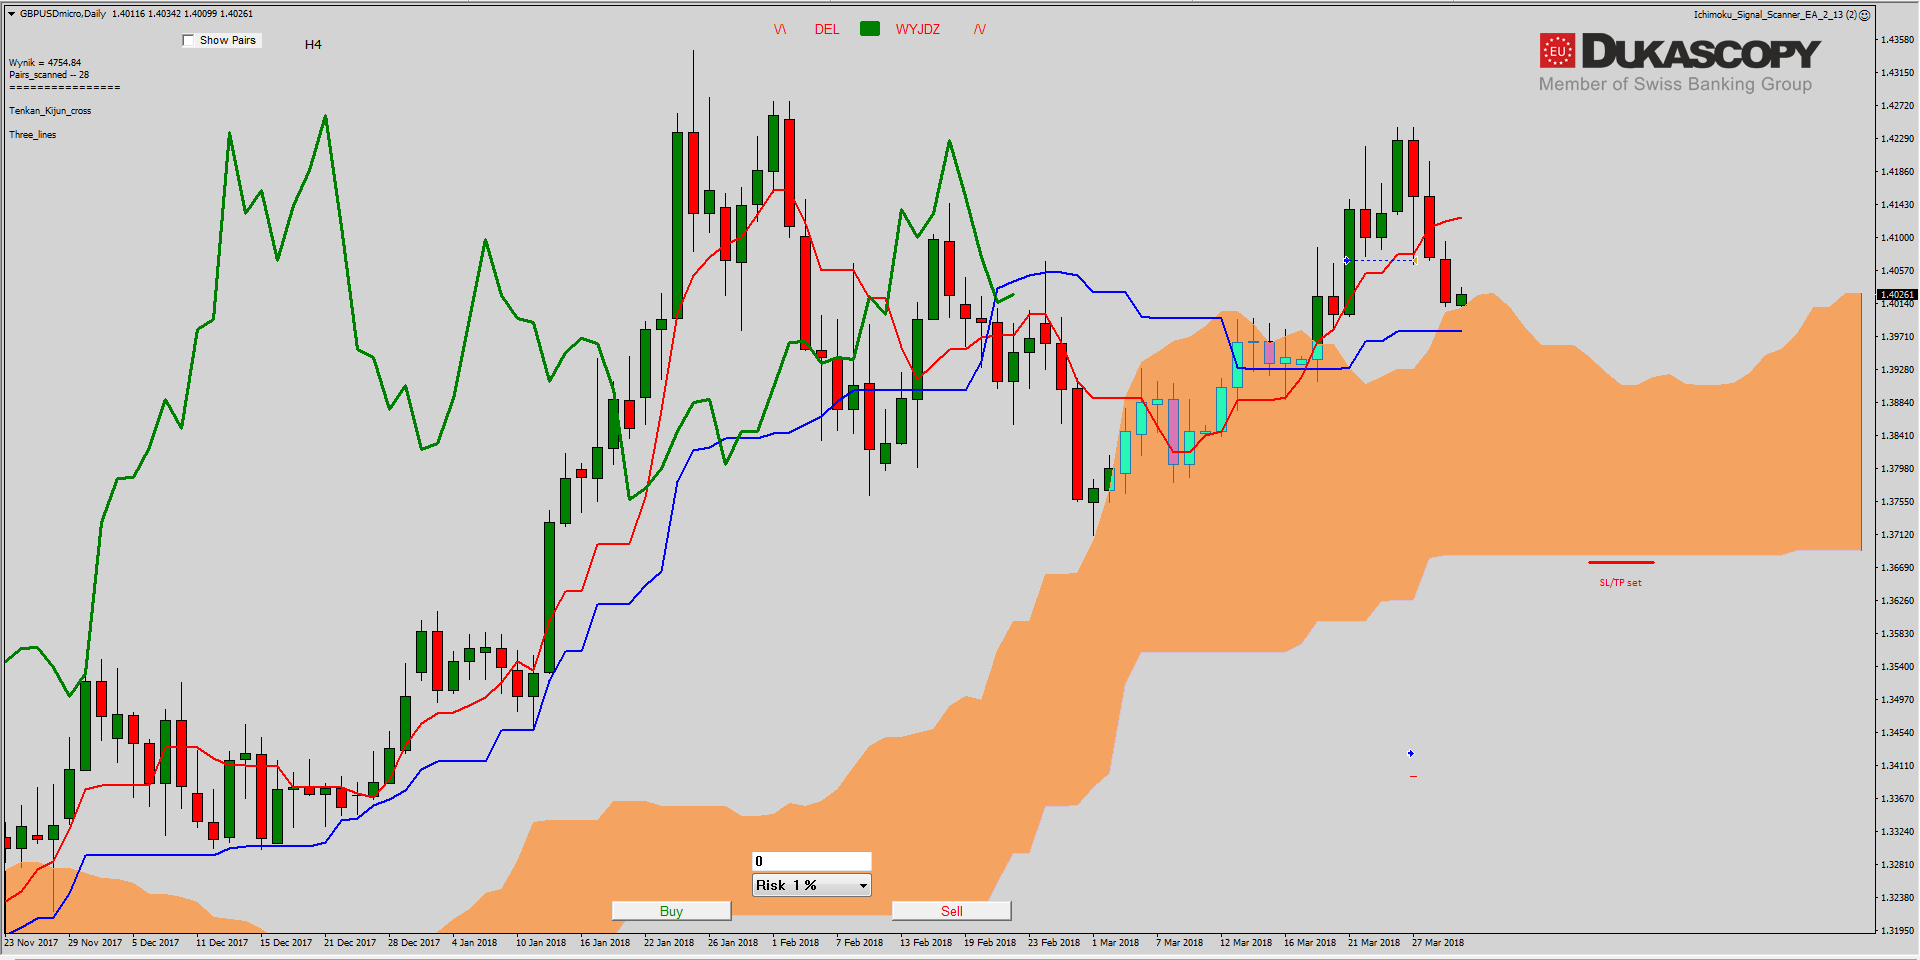 On the Ichimoku chart, the pair after the fall below Tenkan, reached the Senkou Span A line and is trying to defend it for now. We see a slight reaction of demand. Both lines are still set up bullish, and the price is above KIjun, which is why I am looking for a position for an upward scenario. Because the graph is near Kijun, which is flat, I assume that it will be tested and in this area on the chart H4 I will look for entries.
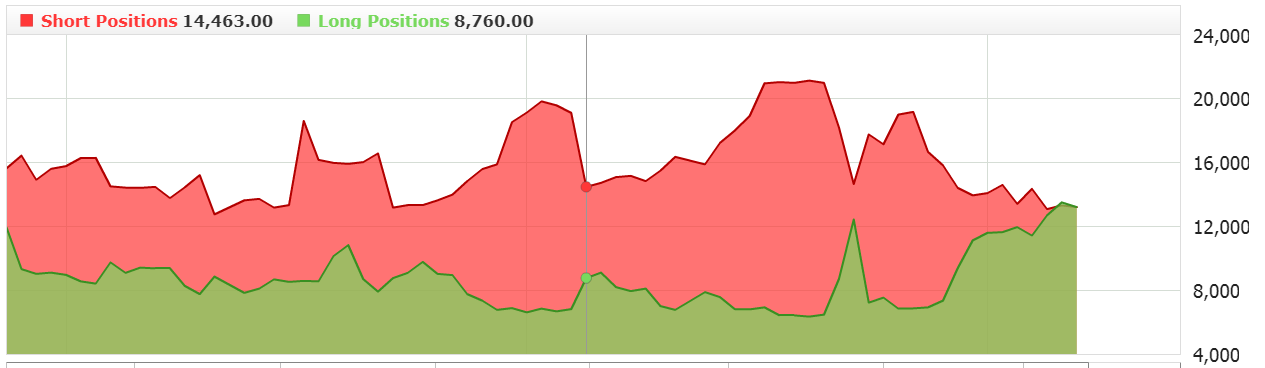
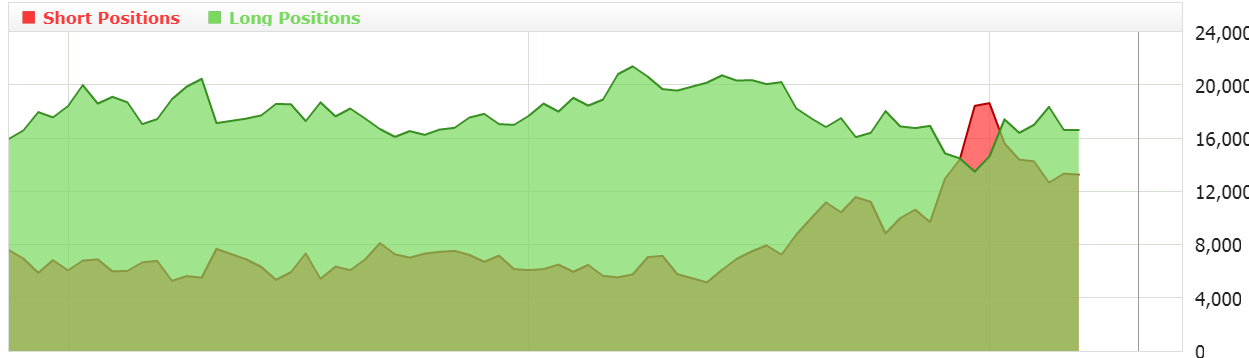
Such a scenario confirms the sentiment, on which we see an increase in long positions with simultaneous reduction of short.
The USD/JPY for two days remains in a correction of the last upturn, which has not yet been finalized. I assume that the current decline is the fourth wave and after the end we will see another attempt to grow towards the key resistance zone. If the pair rejects these levels once again and a downward correction is made, then its character will show us the current increase is the wave of 1A, or as I mentioned last wave C in irregular adjustment.
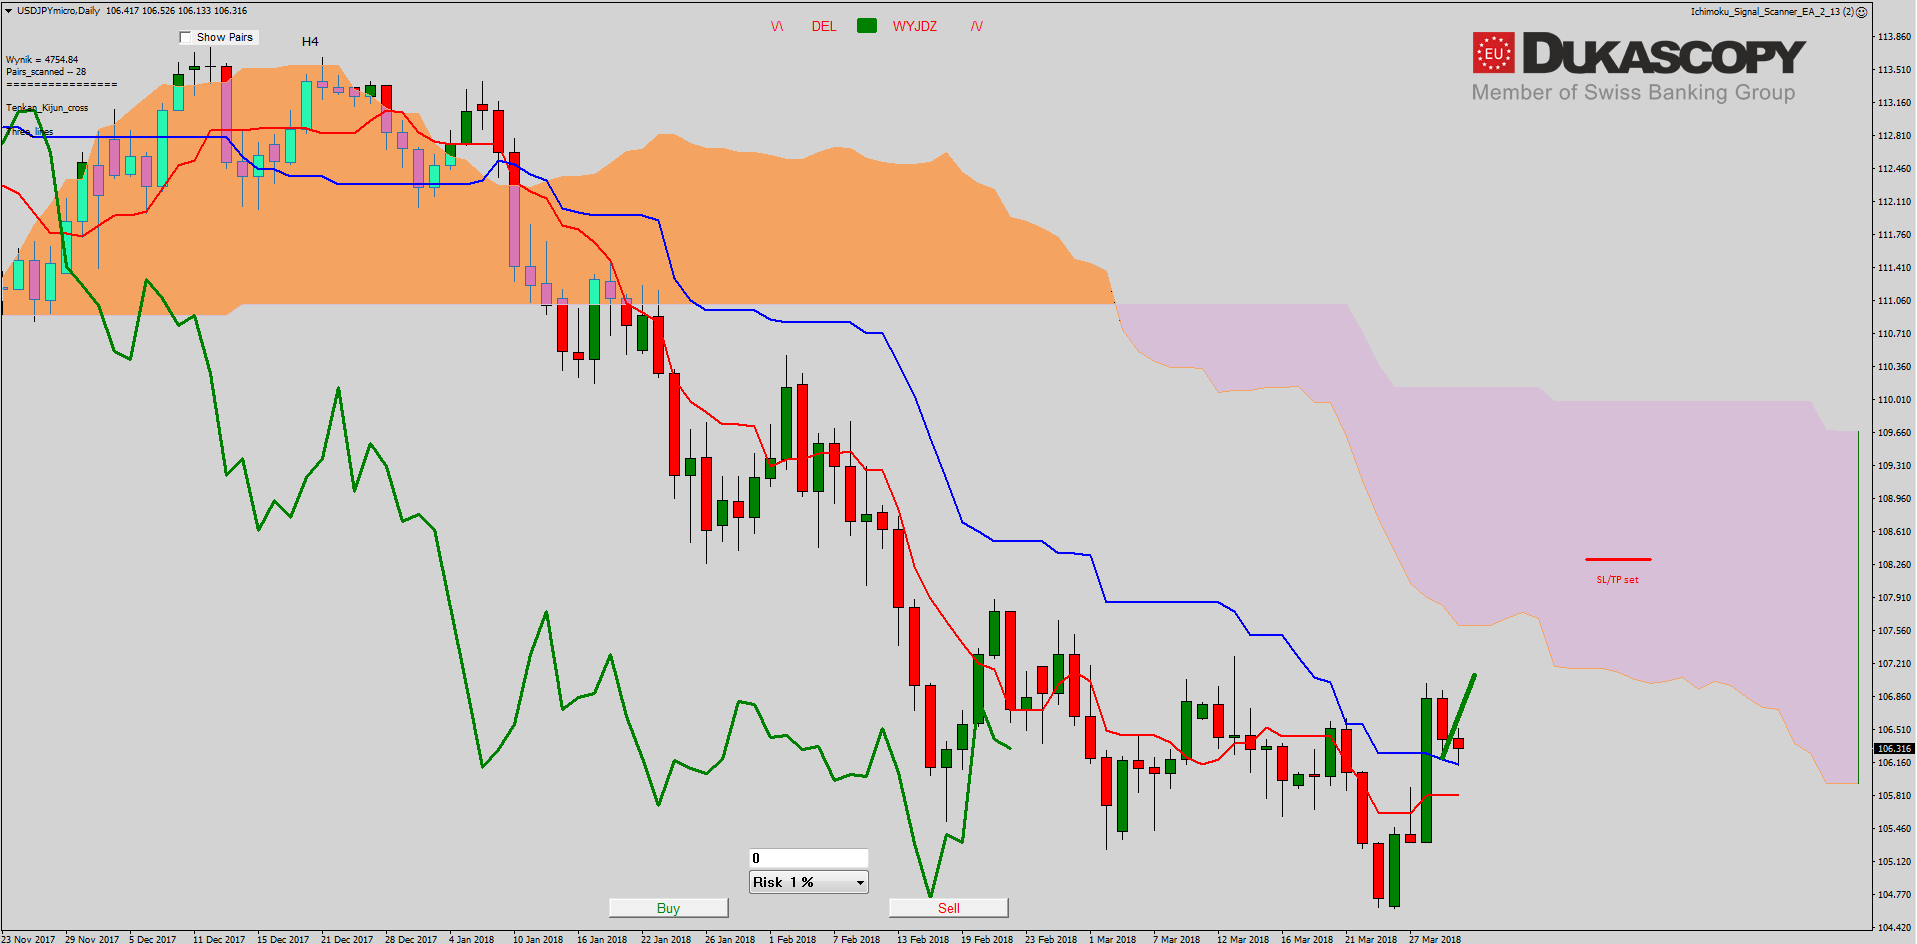
The Ichimoku chart shows that the pair managed to close above the Tenkan and Kijun lines . Such a system may suggest a willingness to continue growth, for which the first goal should be the Senkou Span A line. That’s what I’m counting on and waiting for re-test Kijun and the signal on H4 in line with the Ichimoku principles. Currently, the pair is testing from the top the Senkou Span B line in a bearish cloud. Stronger upward movement and overcoming the Tenkan line will be a opportunity for entering long position.


 Review")


