The US S&P 500 index has already made up all the strong downward movement we witnessed in December 2018. As can be seen in the daily chart below, buyers stopped at a key level of resistance at 2812.70.
During the upward movement, the price was supported by the average EMA 10/20 channel and so far none of the sessions has been below the 10-day average. As long as this situation persists, the growth dynamics remain unaffected.
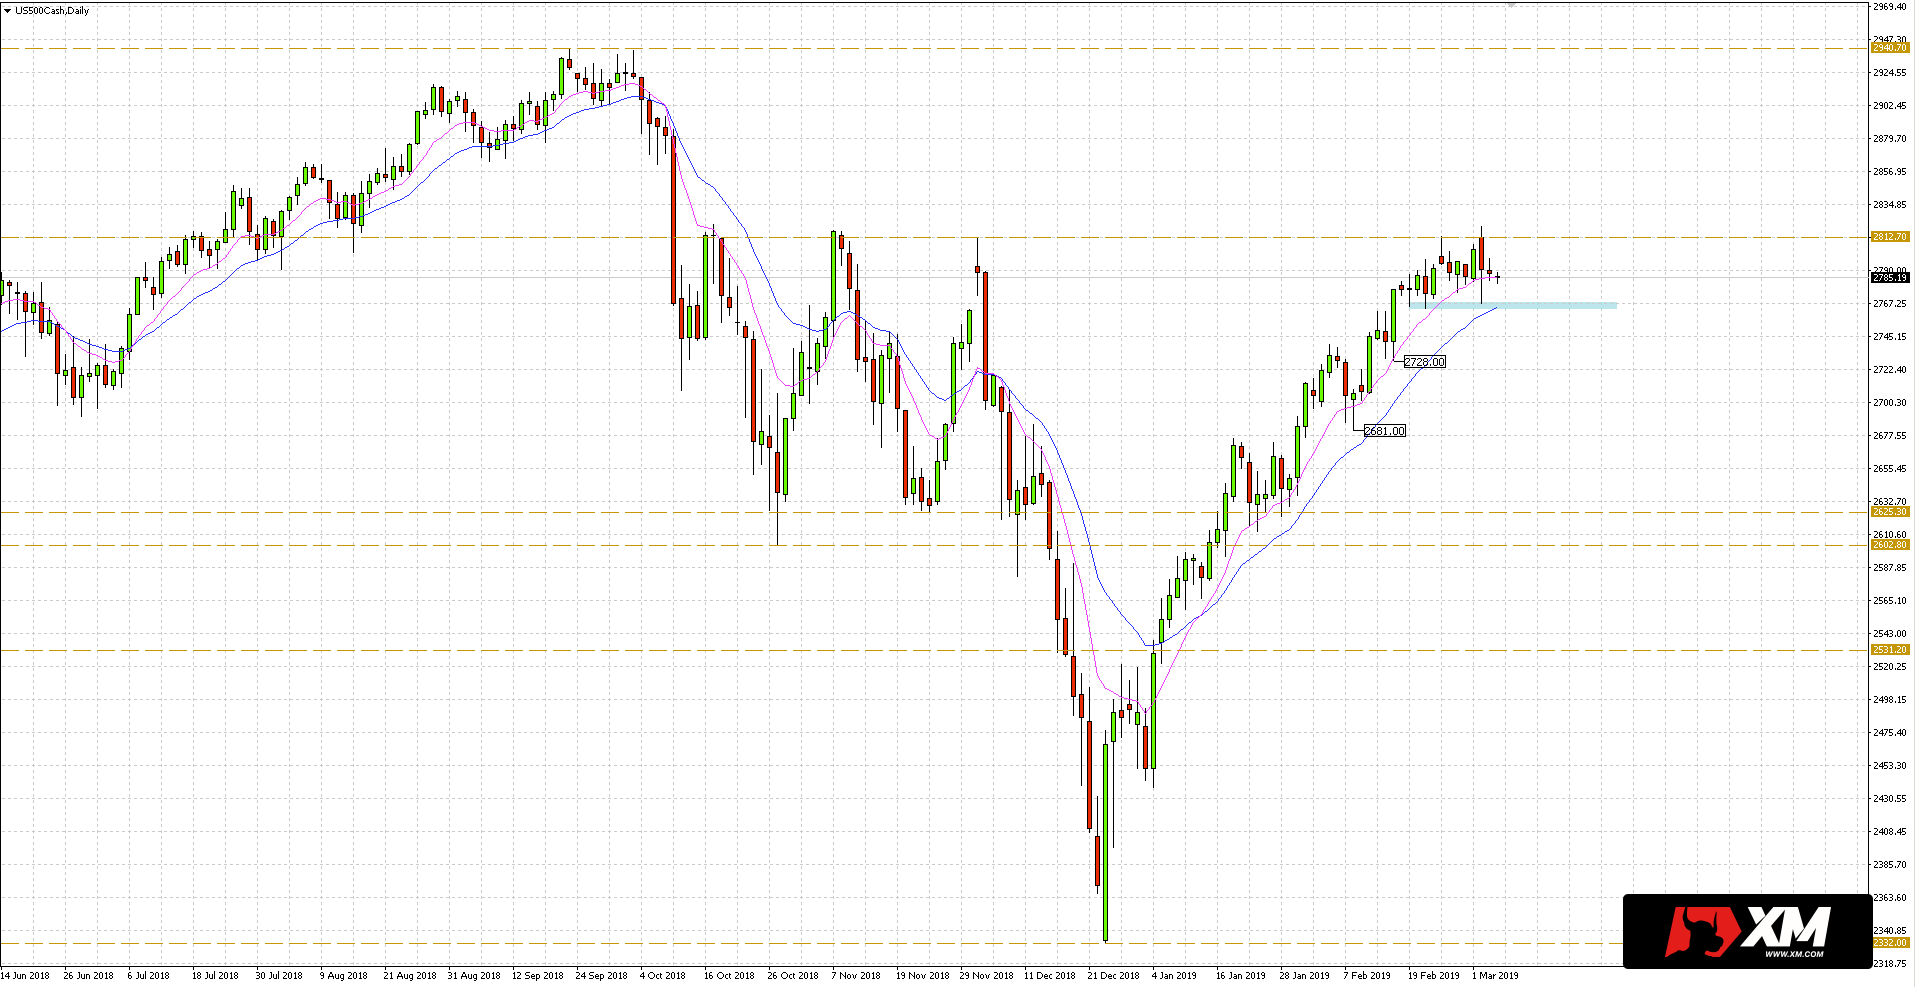
If the resistance is successfully overcome at 2812.70, the price can continue to reach historical highs of 2940.70. But what if the resistance is positively tested?
Deeper rebound can be expected after closing the session under the 20-day EMA / horizontal area around 2767D. Under this scenario, the sellers will reveal further levels of support at 2728, 2681 and 2625.
Join us in our new group for serious traders, get fresh analyses and educational stuff here: https://www.facebook.com/groups/328412937935363/


 Review")


