Previous analysis was quite profitable to investors that opened long positions. I indicated resistances at 2100 pts for S&P500 and 10500 pts for German DAX. Upward movement was continuing at both indices until they reached mentioned levels which caused rebound. On Wednesday there will be FED decision about interest rates, we should be prepared for a higher volatility that will occur then.
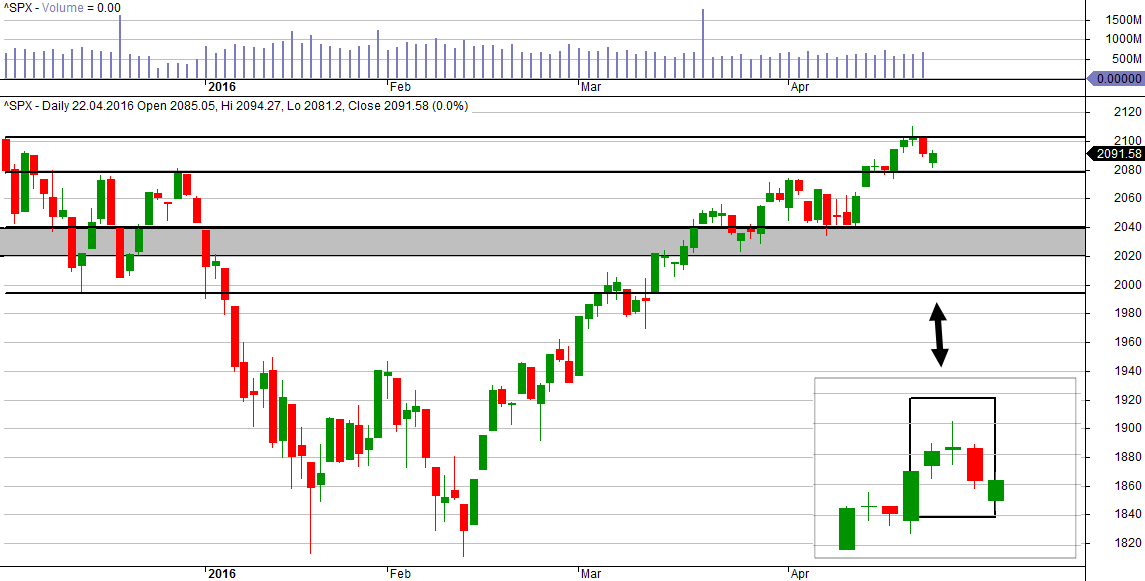
S&P500 time-frame daily
Last week 2100 pts was tested. As I expected that level caused rebound. We can see at the chart below the evening star pattern. This pattern is compound with three candles and it forecasts further declines. Nearest supports are located at levels 2080 pts and 2040 – 2020 area. Right now because of the strong resistance and fact that since mid-July there wasn’t any bigger correction at S&P500 right now it is likely that correction will occur.
YOU CAN START TRADING ON FOREX MARKET USING FREE XM BROKER ACCOUNT.
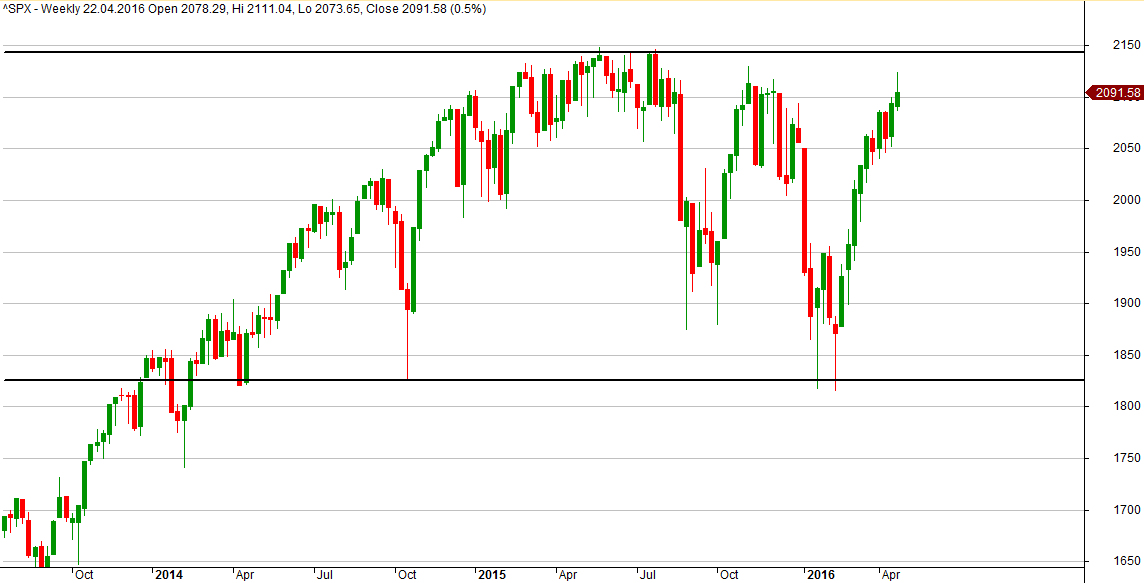
S&P500 time-frame weekly
At the time-frame weekly we can see next important resistance at 2130 pts. So if demand will break current resistance at 2100 pts upward movement will finish just 30 pts higher at more important level which has been stopping bulls for more than a year.
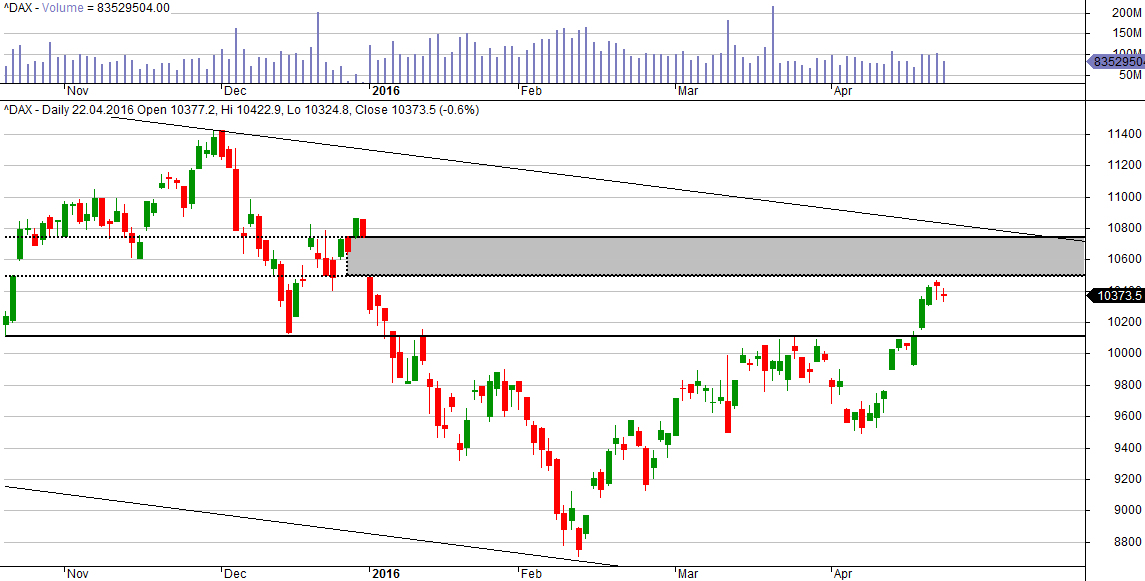
DAX time-frame daily
As we can see at the chart below, right now before the bulls there is a huge downward gap which was formed in January 4. That bearish gap is right now huge resistance for demand. It contains between 10500 – 10750 area. If rebound occurs nearest important support will be located at 10100 level.
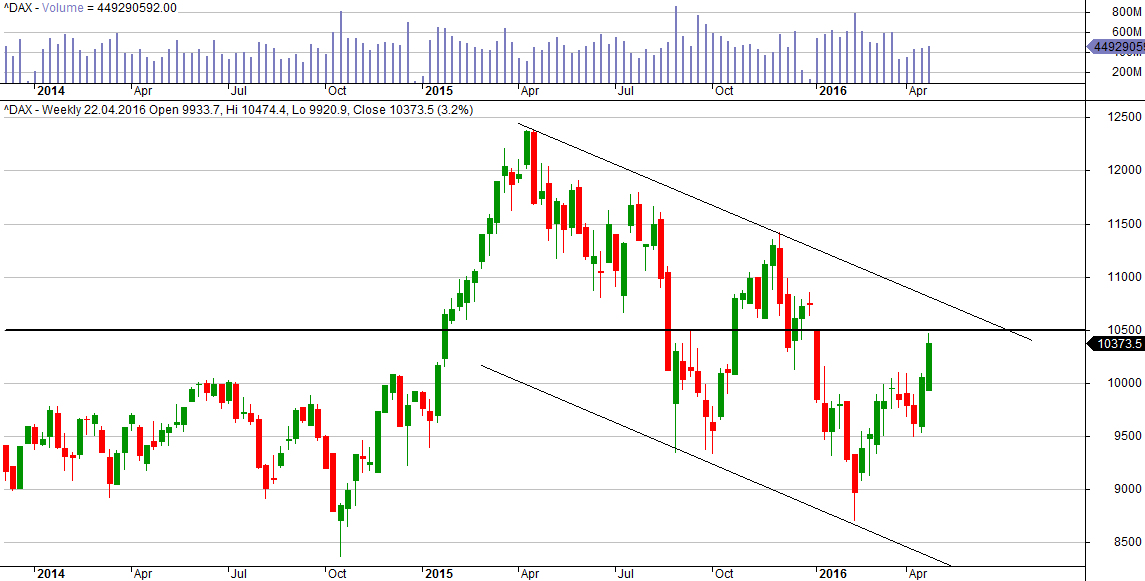
DAX time-frame weekly
Just above mentioned resistance there is located upper limit of bearish regression channel in which the price has been moving since April 2015. Right now that level is located at 10800 area. There is every indication that DAX should rebound and starts the correction.


 Review")


