After clearing the major resistance level at 1.34605, the USDSGD pair started to accelerate north maintaining the classic structure of uptrend. Most of the professional price action traders have already gone long in the USDSGD pair after the formations of the bullish pin bar near the 100 days SMA and bullish trend line support level at 1.36878. Those who are already into a long position might maximize their profit potential by using the simple trailing stop loss features. The first bullish target for this pair is the critical resistance level at 1.38512. This level is going to play a vital role since a clear break of this level is required to start its extended bullish rally.
USDSGD technical chart analysis
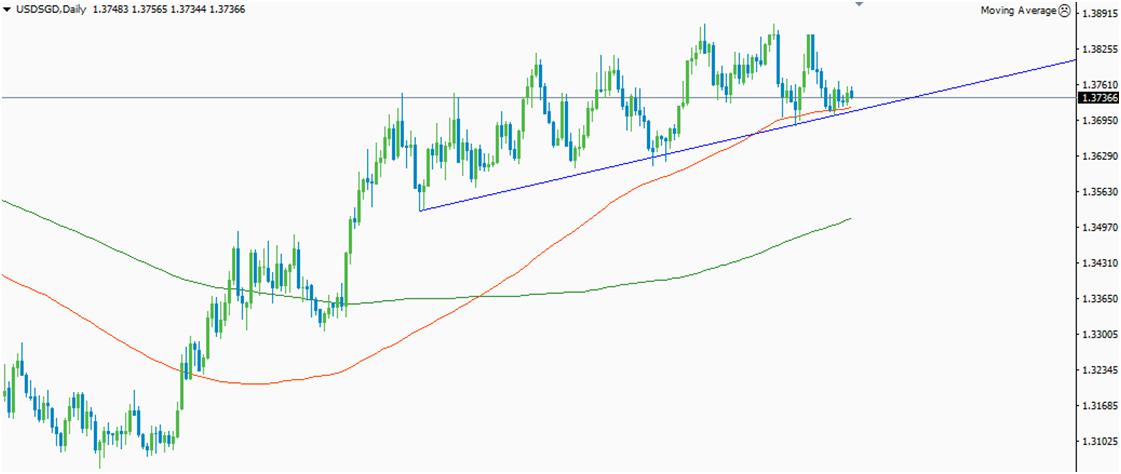
Figure: USDSGD bouncing off from the trend line support
From the above figure, you can clearly see the market is making higher peaks as associated with higher lows. Currently, the bulls seem a little bit exhausted and we might see some retesting of the major trend line support at 1.37137.This level is also reinforced by 100 SMA which means the sellers will have a very tough time breaking this level. The first bullish target for this pair is the high of 31st October 2018. A daily closing of the price above that level will eventually lead this pair towards the next major resistance level at 1.38746.This level is going to provide an extreme level of selling pressure to this pair since we have plenty of resistance candles. However, a clear break of the price above the major resistance level at 1.38746 will eventually lead this pair towards the next major resistance level at 1.39644.This level is also reinforced by the 61.8% bearish retracement level drawn from the high of 1st January 2017 to the low of 21st January 2018. According to the leading analyst of the Forex trading industry, a daily closing of the price above this level will confirm the end of a long-term bearish rally in the USDSGD pair.
On the downside, we need to break below the current trend line support level at 1.37037 to see some fresh selling pressure. Once the bears manage to clear the critical trend line support level, the pair will eventually fall towards the next major support level at 1.36100. This level is most likely to provide temporary support to the USDSGD bulls, but buying the pair at that level will be an immature act. A daily closing of the price below the 1.36100 marks will lead this pair towards 200 SMA. The dynamic support level at 1.35164 (200 SMA) might provide an excellent buying opportunity to the long-term investors. However, the traders are advised to wait for bullish price action confirmation signal near the 200 SMA for the execution of long orders. If the bulls fail to regain their momentum near the 200 SMA, the sellers will become more aggressive which might result in a sharp decline in the USDSGD pair.
Fundamental factors
The recent performance of the U.S economy compared to the Singaporean economy is relatively well. However, the ongoing crisis regarding the year-end rate hike from the FED is weakening the mighty dollar bulls against most of its major rivals. If the FED officials manage to hike their interest rate with a hawkish tone, chances are very high we will see an extended bullish rally in the USDSGD pair. On the other hand, a rate hike followed by a dovish statement might weaken the U.S dollar for a prolonged period of time. Moreover, drastic action from MAS (Monetary Authority of Singapore) prior to the closing of the year 2018, to stabilize the economic crisis might boost the Singaporean dollar against most of its major rivals. So, the USDSGD bulls are not in the safe heavens when it comes to fundamental factors. Considering the technical and fundamental parameters involved both short term and long trades seem to be justified by the actions of retails traders in the Forex market.
by Dwayne Buzzell


 Review")


