Quotes of gold shows that currently there is probably a correction of recent increases. Declines as yet are not very dynamic and they look like a correction.
Try out XM account and get free $30 bonus without any deposit

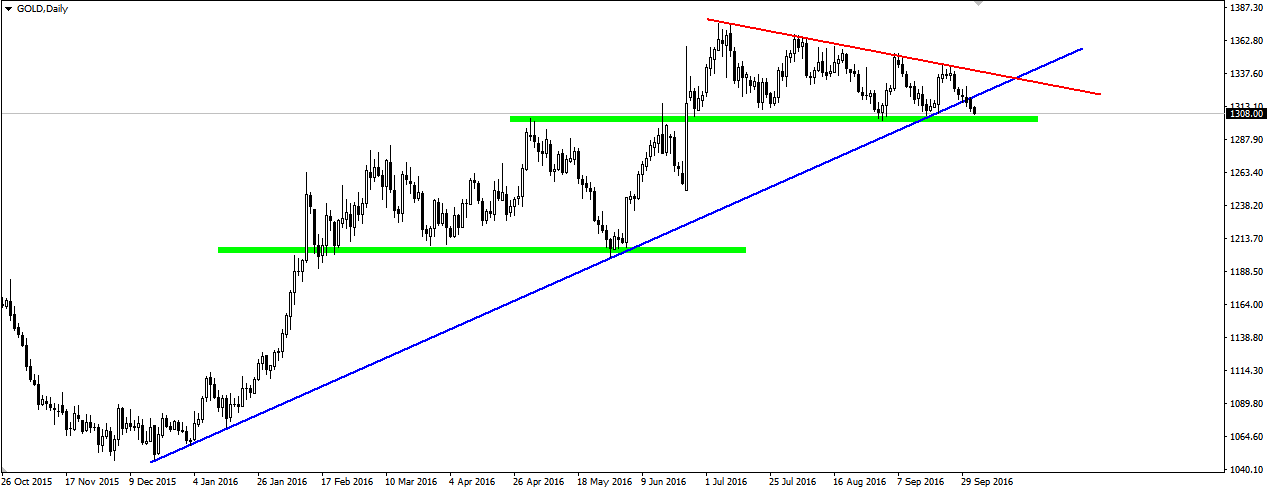
An interesting situation is on the daily chart. The bullish trend line was broken, although not always breaking a trend line means end of a trend. More importantly, we continue to see price above a key support area in 1300 – the level of the previous peak. Similar support was well-respected in the past. Current one gave a few rebounds, but one after another they are becoming weaker. This may indicate a weakness in demand or on-going consolidation. Any breakout of the corrections red line would therefore give a fairly strong signal that bulls came back to the market.
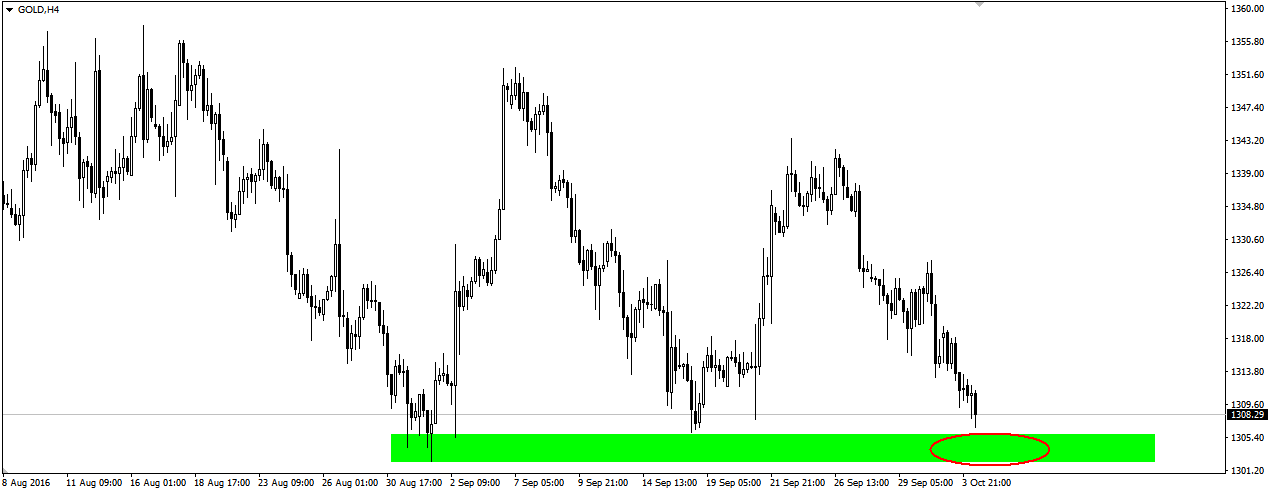
It seems that in the short term, we can expect at least another bounce from the support. At the H4 chart we can clarify the support area which was set by the previous two lows. It seems like any bull signal in the region of 1302 – 1305 may be used to initiate the following bounce to the top.


 Review")


