Let’s start from wide view which shows bearish trend and correction which so far ended on the trend and what’s more important on key resistance which is the level of previous highs.
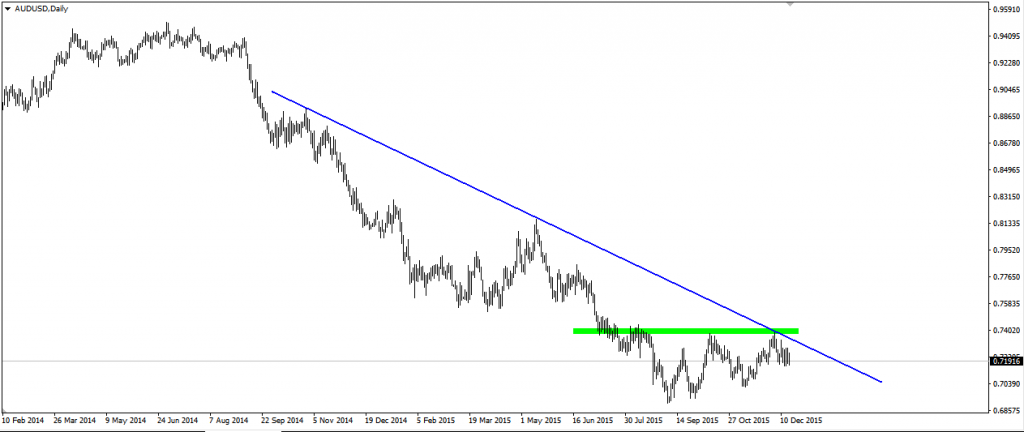
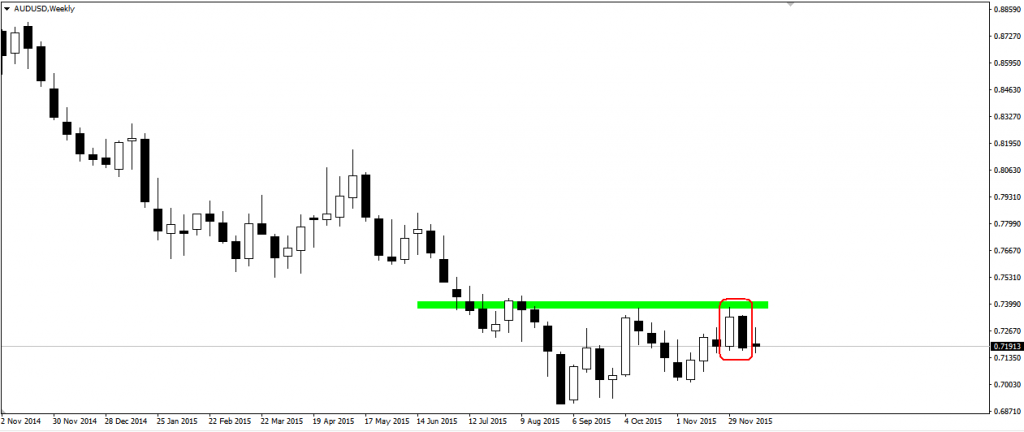
Weekly time frame presents engulfing pattern which fits this bearish sentiment. If it should be accomplished prices should go in the direction of last lows.
THIS ANALYSIS WAS CREATED IN COOPERATION WITH XM BROKER. OPEN FREE XM ACCOUNT AND GET FREE $30 FOR YOUR TRADING.
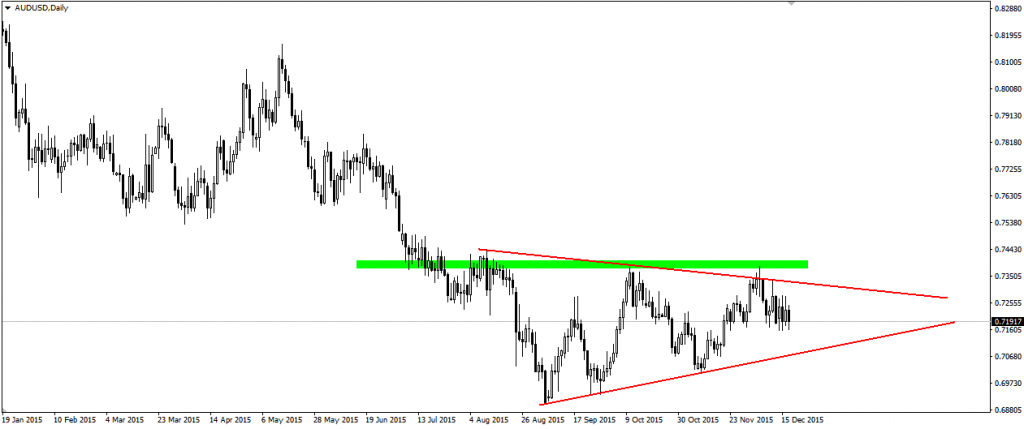
Looking closer at the daily chart we can see interesting situation. Breaking current pattern should point the direction for a longer time, currently in the short time we are interested only in getting to another band.
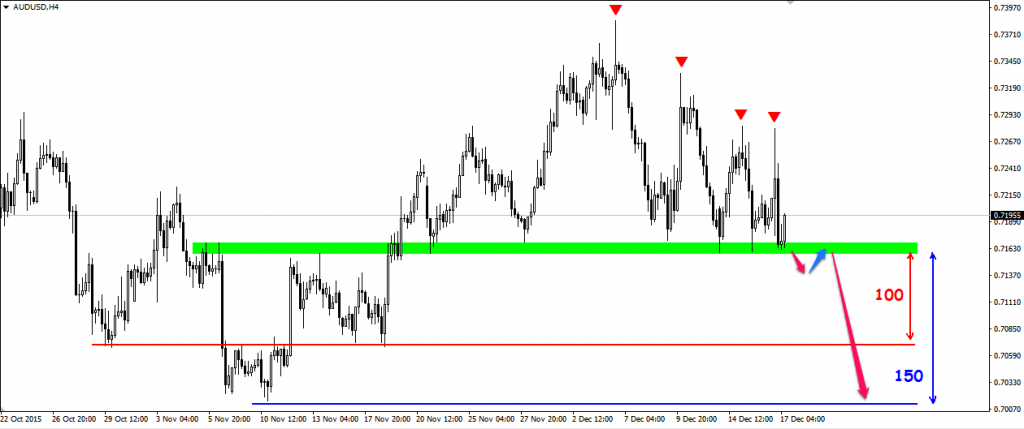
It looks like we have some space for decreases. The same situation we can see on H4, where bears are getting stronger around key support at 0.7160. Interesting situation can happen after fall of this level. I would try to play short position on lower time frames after re-test of this level from below. The range of another lows is about 100-150 pips.


 Review")


