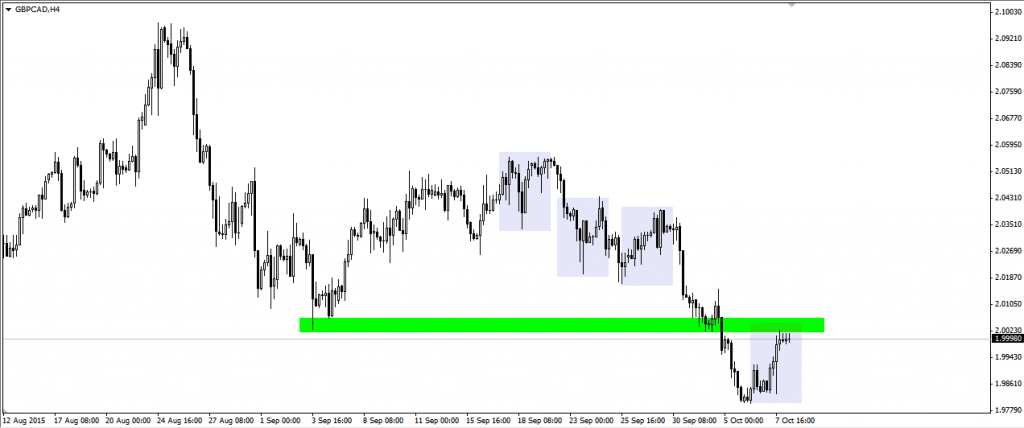
There is quite interesting opportunity on H4 chart on GBPCAD. For some time you can see bearish trend forming, the biggest evidence of that is breaking last low. Currently we may see re-test of broken level. Bigger moves should start soon, when we will get to know important data from UK. You can also take a look for previous corrections which just ended with similar range.
This analysis was created in cooperation with XM broker. Open free XM account and get free $30 for your trading.
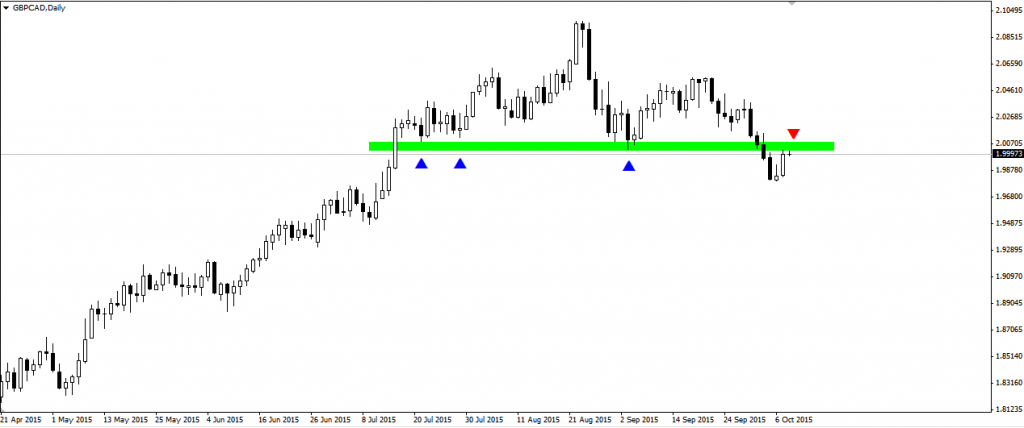
Daily chart confirms getting below key support. There is also a setup of two lower highs and lows. It seems like we can see some bigger correction of bullish trend.


