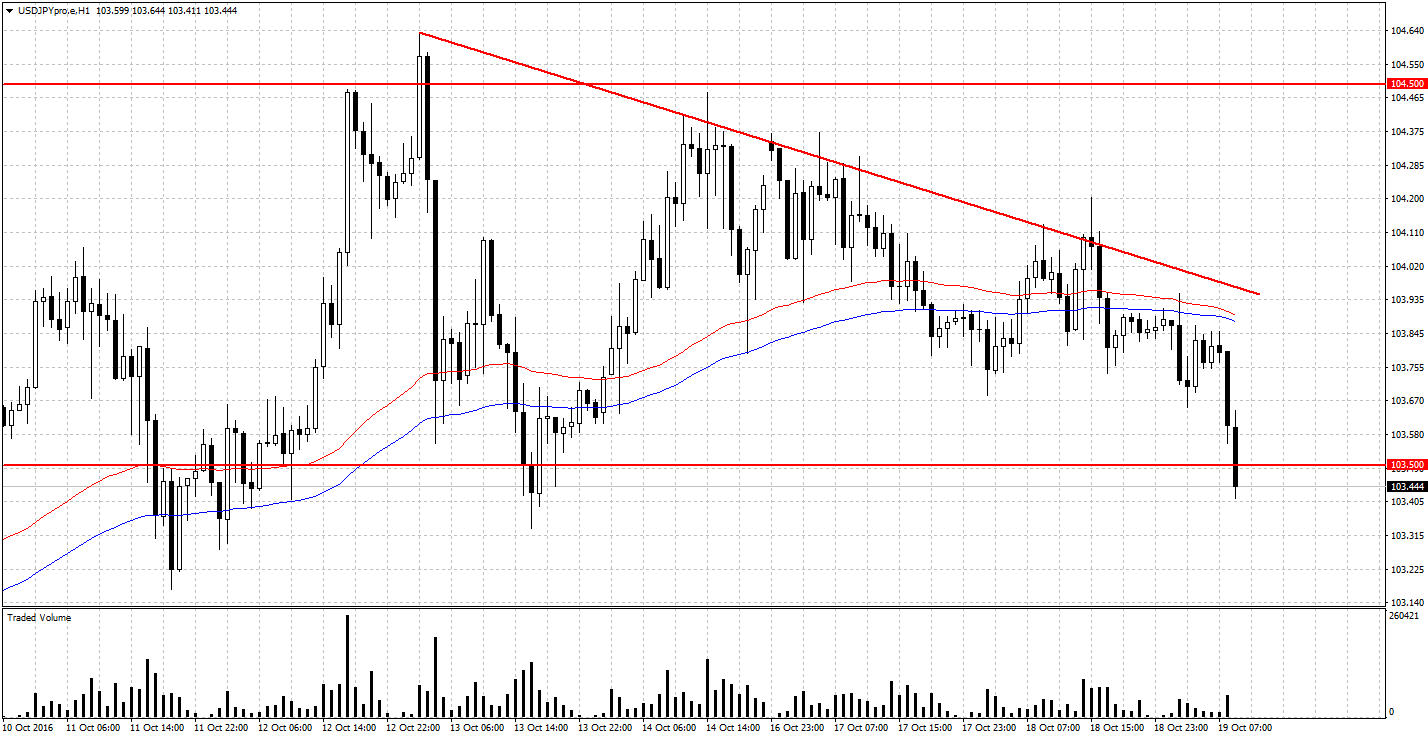
On the USDJPY H1 chart can be seen a slowdown in the bullish trend evidenced by the recent highs and lows. An additional tool to determine the deceleration of the trend are the moving averages EMA on H1 (75- and 100-periodic), which are flattened and begin to direct toward the bottom. Note that test of round resistance level of 104.500 was implemented in conjunction with a low turnover.
Then price formed a trend line which tests were characterized by a high volume. Currently price checks the support level at 103.500. The last test of the said area didn’t form a higher peak. There was also a low volume during the previous level verification. This points to the declining importance of support. In case of breaking this zone it will be treated as resistance, while the USDJPY will open the way for further declines.


 Review")


