USDCAD (US Dollar vs. Canadian Dollar) is at levels which were seen in 2004. Traders are biding higher levels what asures that the current trend will maintain. The rally is also supported by the structure of the current growth which formed since bottom made in 2012 a characteristic pattern described in Elliott Wave Theory as a ‘Impulse Wave’.
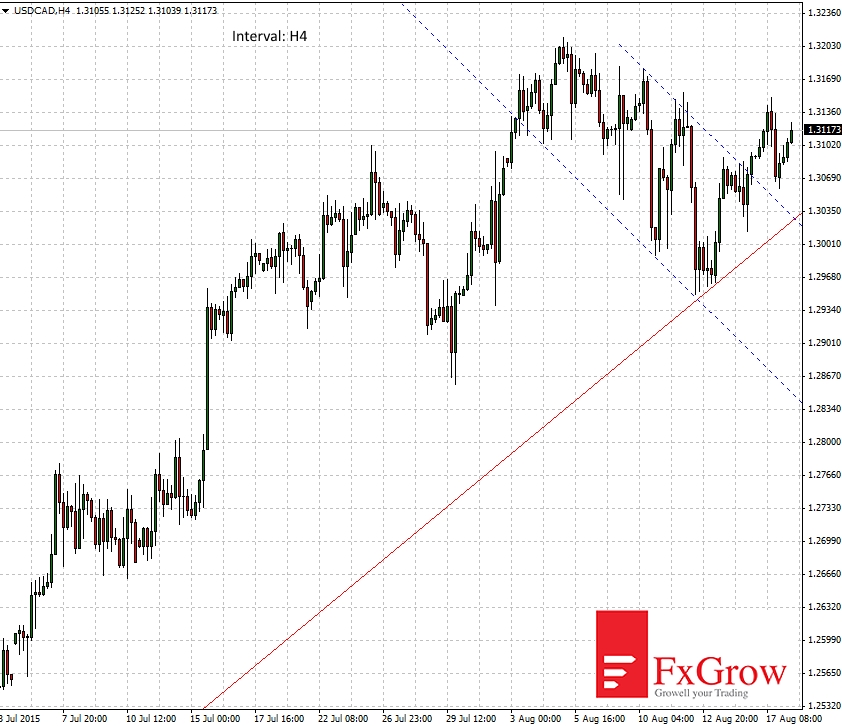
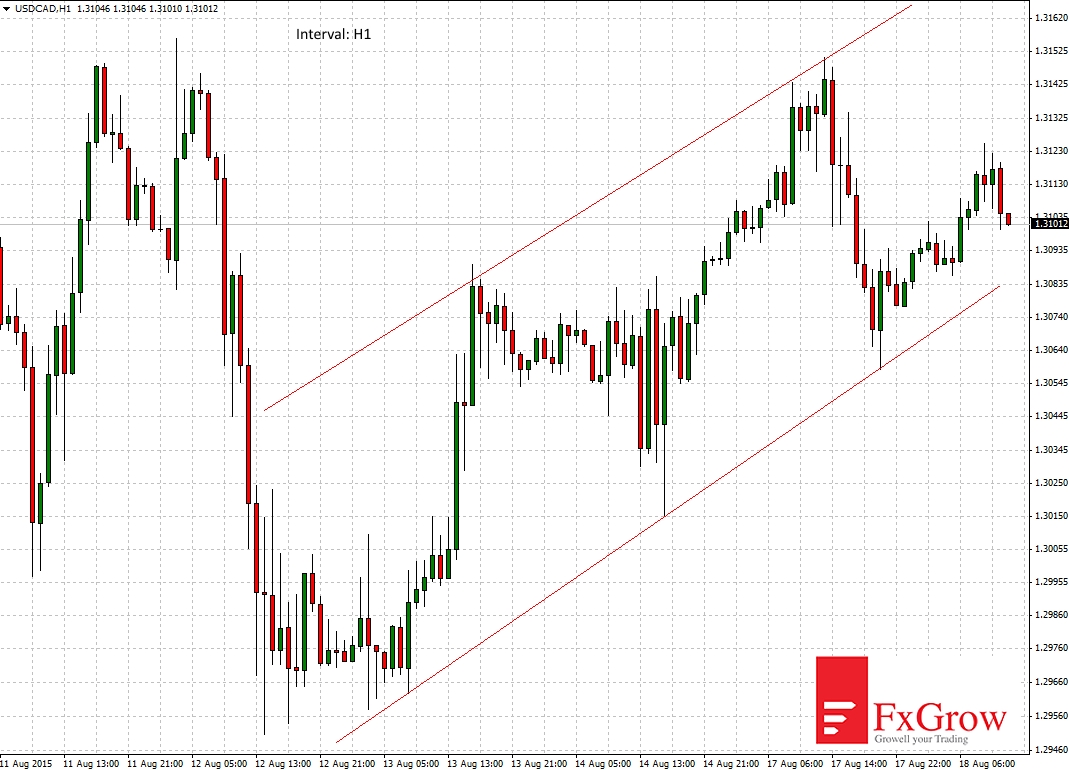
The nearest resistance levels are 1.3212 (last peak), then 1.33 and 1.35. The last level is a Fibonnacci dependence where wave 1 = wave 5. Last week USDCAD breached higher out of the downward channel (H4 chart) and now it is moving towards the last peak. On 1-hour time frame the price tested the lower bound of the upward channel what have triggered a demand-side response (H1 chart).
For this currency pair long positions are preferred.


 Review")


