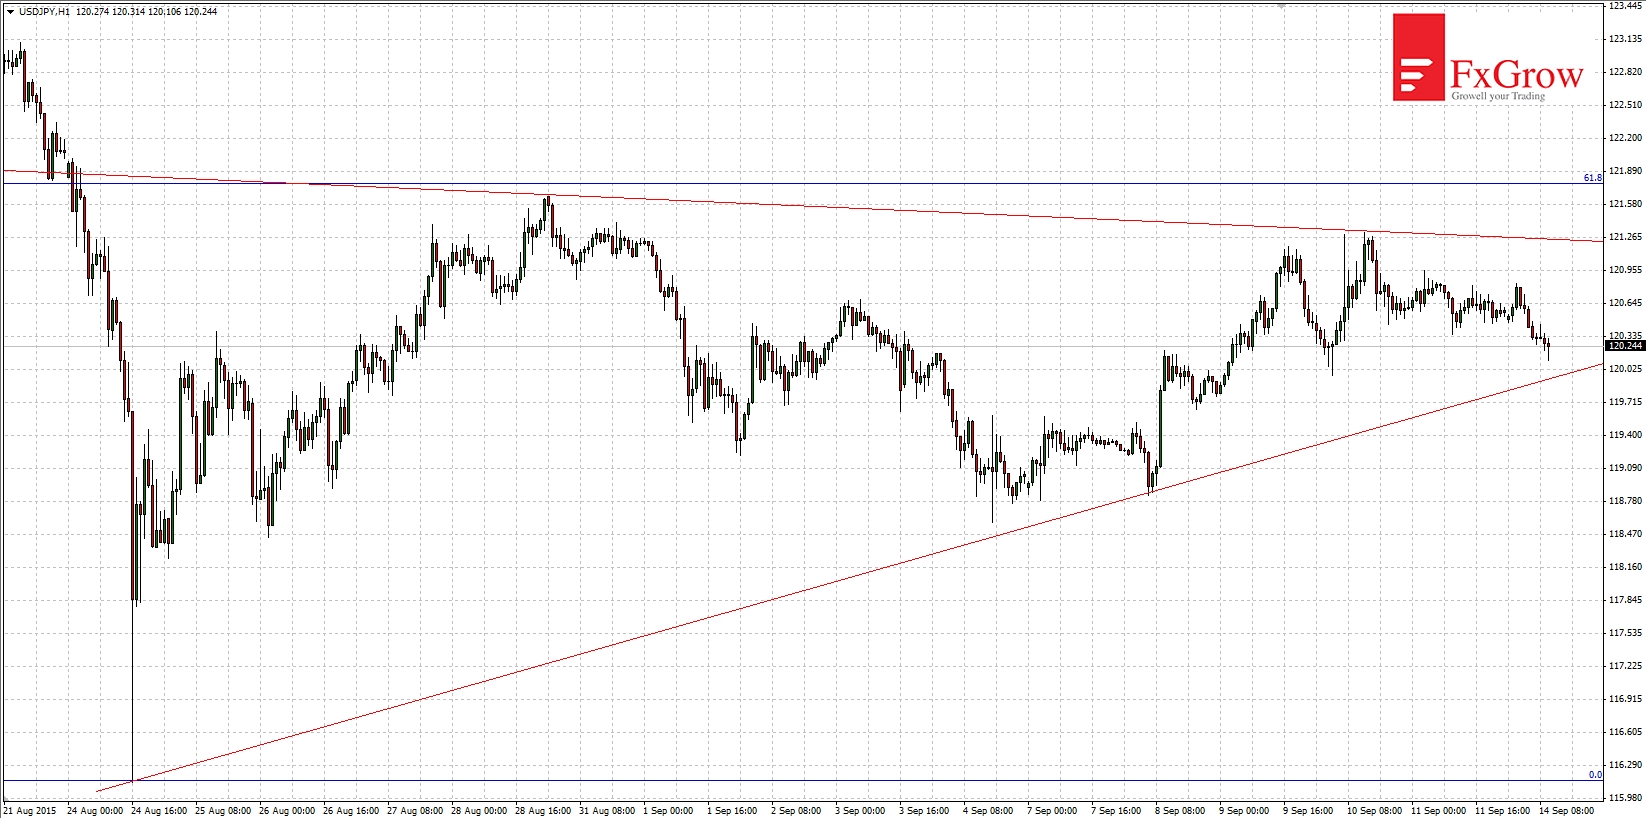
Since 3 weeks USDJPY moves in a triangle, whose lower and upper band have been tested for two times. Correction which lasts for a month was abolished by 61.8% (so amounted to rebound after drop). This suggests that there is still more likely to continue correction than the end of it and return to move up. In the triangle we are slowly running out of space. If the market will react on that formation effective break out will point further movement.
Wider view D1
Since 2012 USDJPY is moving in an upward trend. At that time the price rose from 76 in January 2012 to 120.50 last Friday. At the level of the maximum of August, price was recently in 2002. For now this resistance stopped further upward movement. On the other hand strong suport is on the level 116. Last time it was tested in 24 August. This support for almost a year does not allow price to fall. 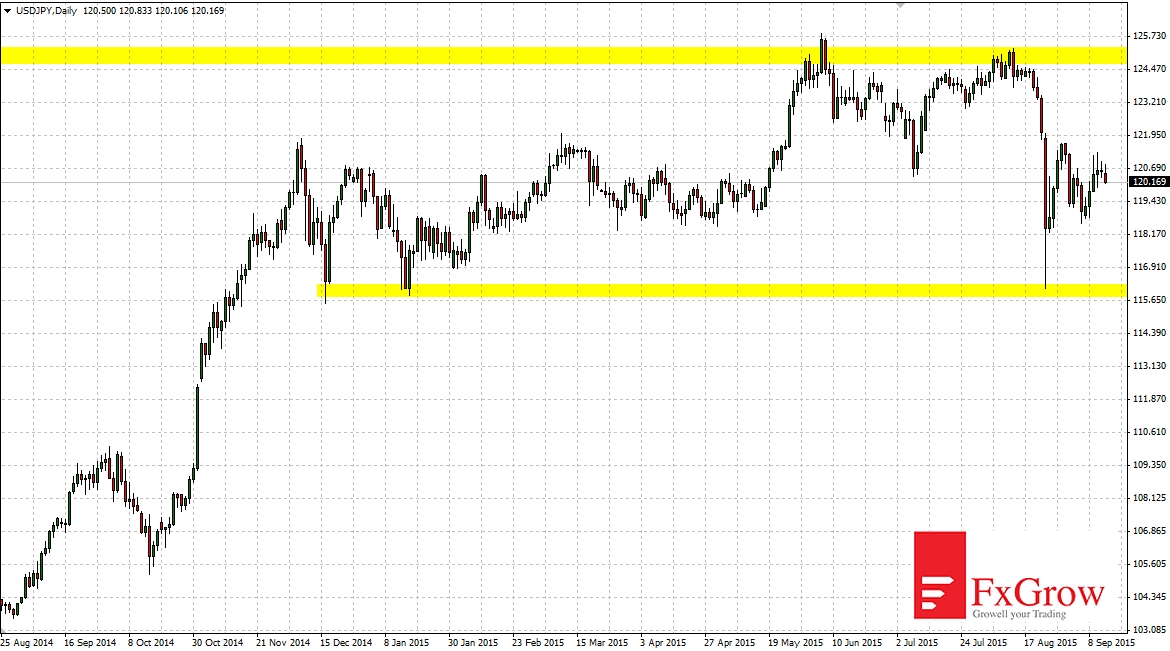


 Review")


