It has not been a successful year for the Japanese yen (JPY). Starting from January 2022, the Japanese currency has lost more than 10% against the US dollar. The yen has experienced particularly severe losses since the beginning of March this year. – After a short consolidation, the last 7 weeks have seen an uninterrupted strong upward trend on the USDJPY pair and a JPY loss to USD of over 11%.
- The difference in interest rates in the U.S. and Japan as a reason for the weakening of the Yen
- The hawkish FED may push the USDJPY pair to the maximums of 2002
- Completion of inverted head and shoulders formation and attack on the neckline very likely
The Yen’s weakness is due to the interest rate differential between the US and Japan. This difference is widening and hence the USDJPY pair is heading strongly north. US 10-year bond yields reached 2.88% today which is the highest level since 2019.
At the same time, Japanese bonds are trading at a yield of 0.24%. Forecasts for the next weeks indicate further weakening of the yen and the USDJPY exchange rate may soon reach the level of 130 yen per USD dollar.
At the beginning of May we will know the FED’s decision on interest rates in the USA. For several weeks we have been hearing about plans to raise rates by 0.5%, and the market values the probability of such an increase at 88/12, which is close to certainty.
Rising inflation in the USA (8.5%) is forcing the FED to tighten monetary policy, with plans to raise rates at each subsequent FOMC meeting, i.e. every 6 weeks. At the end of 2022 rates may be in the range of 2.5-3.0%.
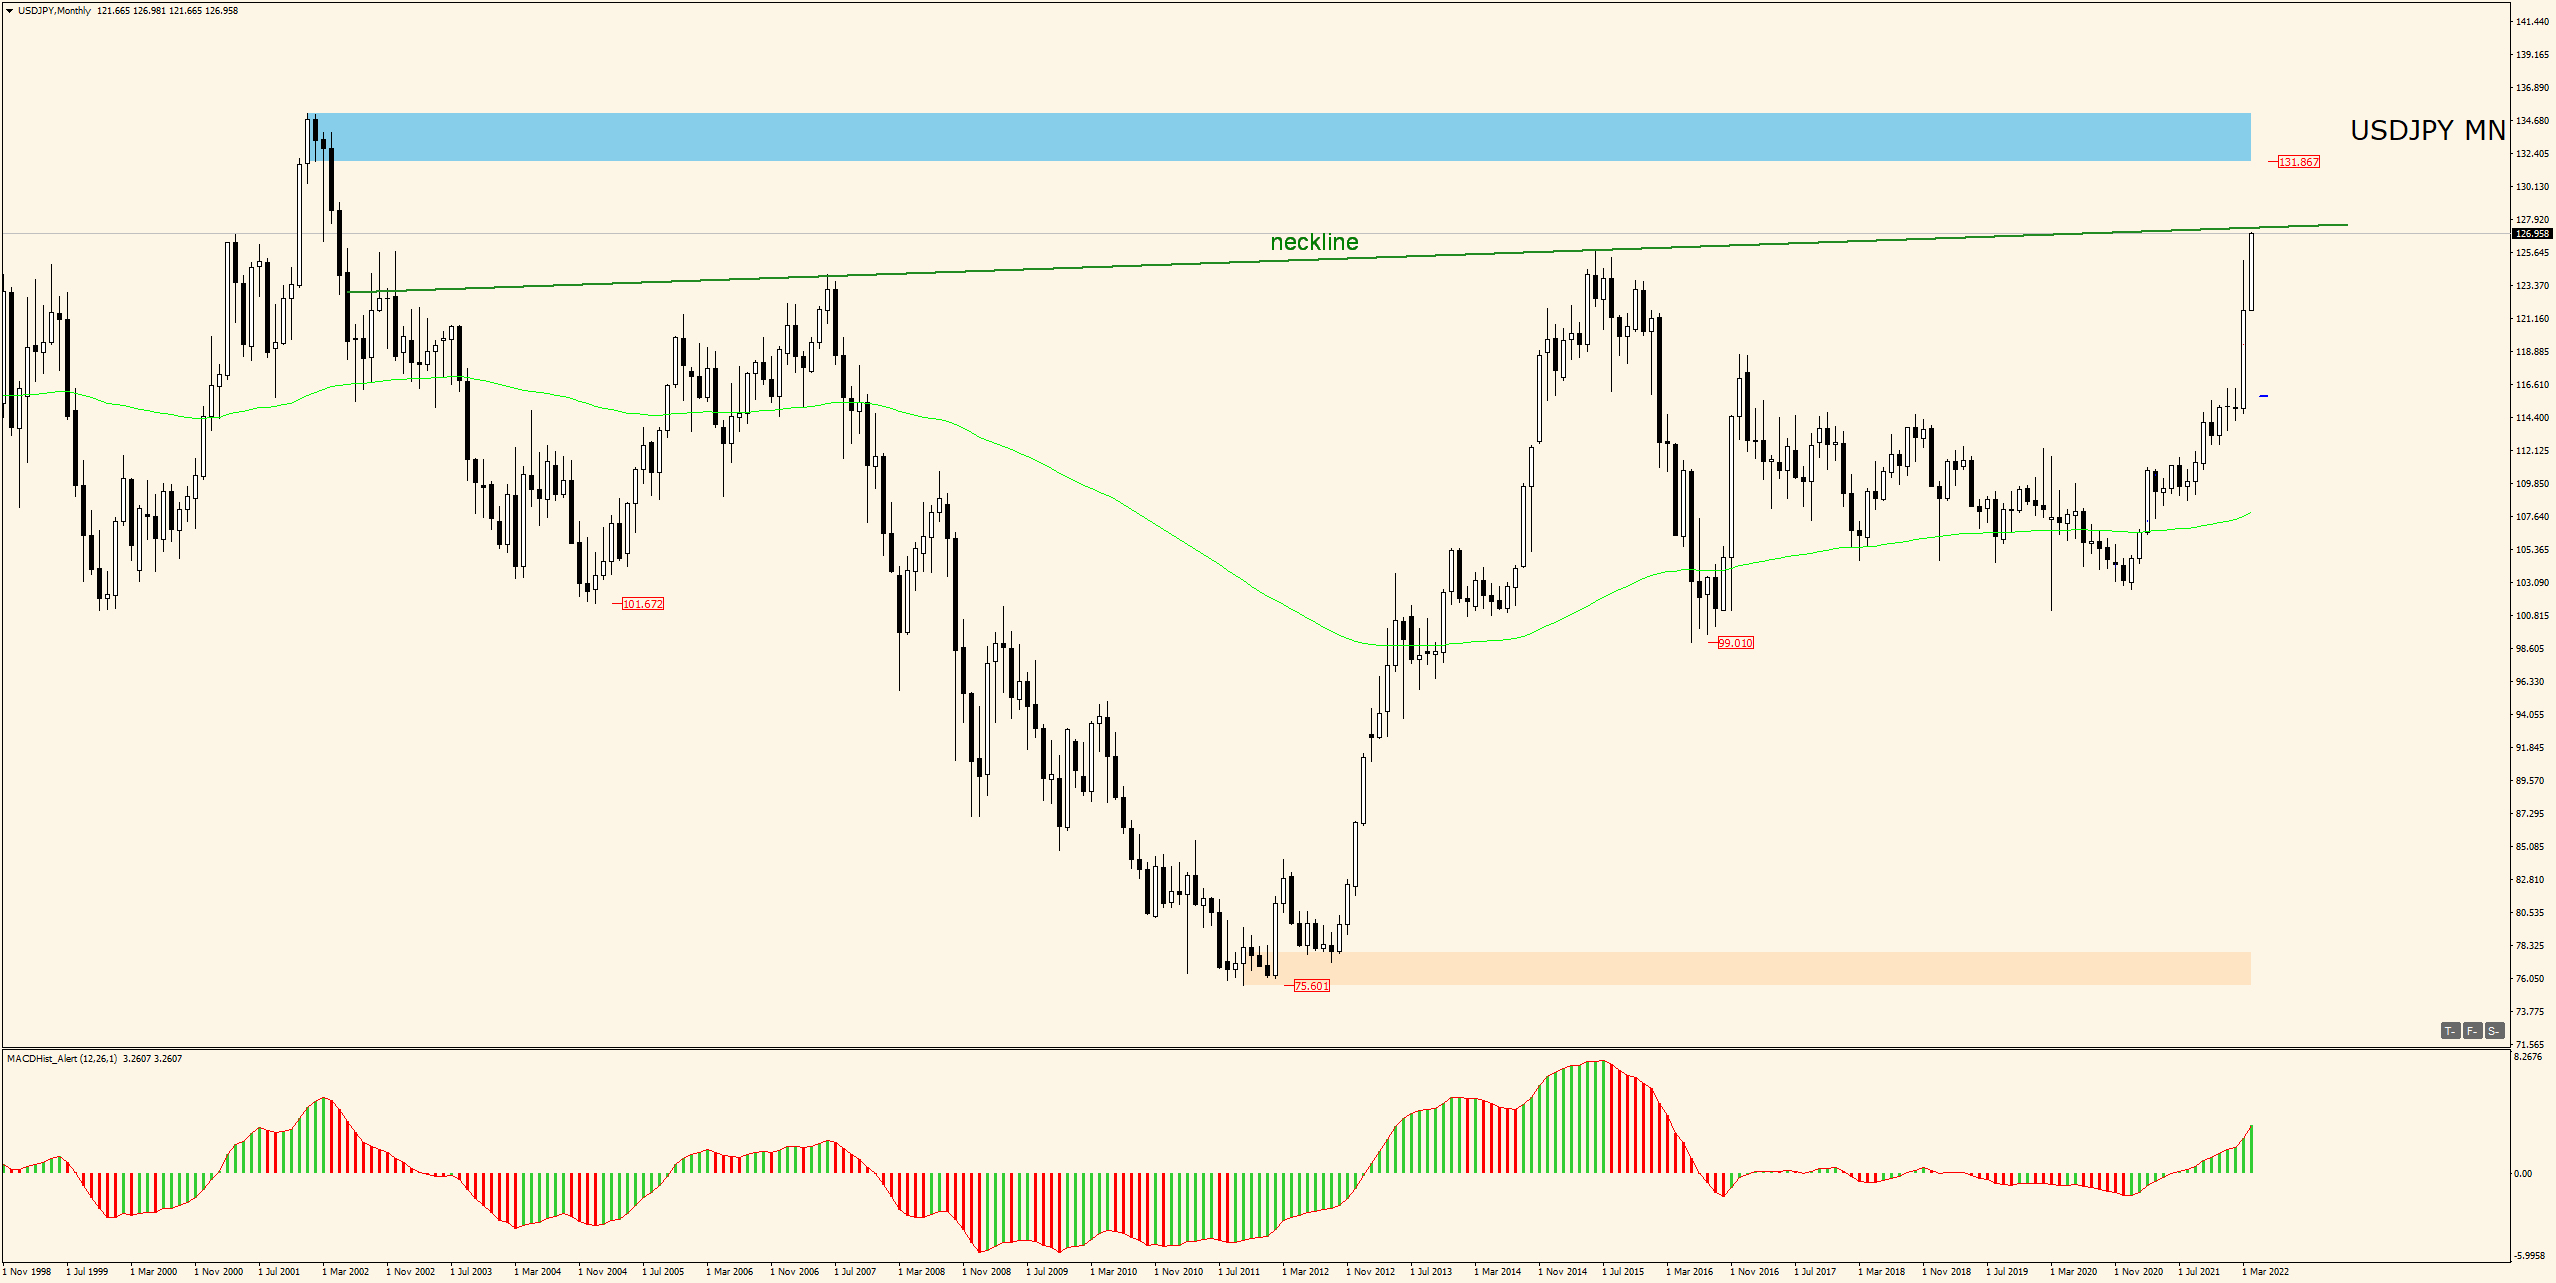
Last week, the USDJPY pair crossed the 20-year maximum (126) and continues to move north. Officials of the Bank of Japan have recently expressed concern about the sharp decline in the value of the yen (verbal interventions), but refrain from any financial action on the issue.
It is unlikely that the BoJ will intervene except as a last resort to keep the 10-year JGB yield below 0.25%, which is the bank’s designated limit.
On the monthly chart, the price is reaching the neckline of an inverted H&S (head and shoulders formation). Breaking the neck line may be a signal for the continuation of the upward trend started at the beginning of March. For the time being it is an instrument in an uptrend and one should look for buying opportunities after deeper corrections with the target of 130 USD/JPY.
LIVE TRADING SESSIONS- FREE ENTRY
I invite you to my – Tuesday’s, 19 April at 08:00-09:00 GMT +1 (London time) live trading session here: https://www.xm.com/live-player/basic
The above analysis is based on the PA+MACD strategy, a detailed description of which you can read HERE . I will talk more about the PA+MACD strategy applied to these currency pairs during the live trading sessions which you can attend from Monday to Friday.
More current analysis on the group : Trade with Dargo
 In our Facebook group, which you can join anytime: https://www.facebook.com/groups/328412937935363/ you will find 5 simple strategies on which my trading is based. There, every day we post fresh analyses of currency pairs and commodities. You can also visit my channel where I post my trading ideas: https://t.me/TradewithDargo


 Review")


