When I was browsed charts for technical analysis I saw interesting situation on USDJPY.
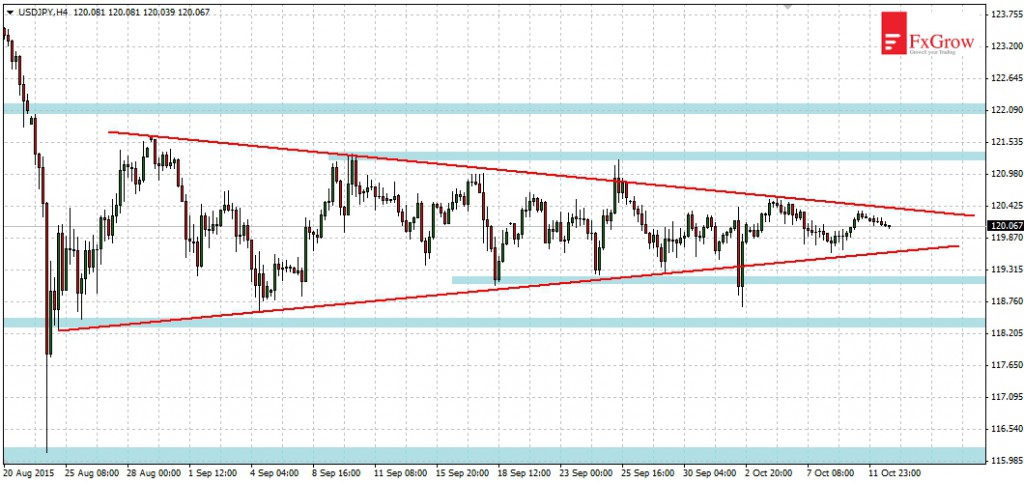
Since nearly two months price is moving in a triangle and already 2 times there has been attempt of his breaking. In September was a first attempt of break above upper limit of the triangle, and next in October a second attempt of break below lower limit of the triangle. Both the first and the second attempt ended with a false breakout, and the triangle is already beginning to have very little space to move. Currently, we should observe in which direction the proper breakout will go. If above, the next resistances are at 121.20 and 122.00. If below, the next supports are at levels: 119.10, 118.50, 116.20.
Try FX GROW. Spread on AUDCAD is 0.0001 also STP/ECN execution, full transparency.
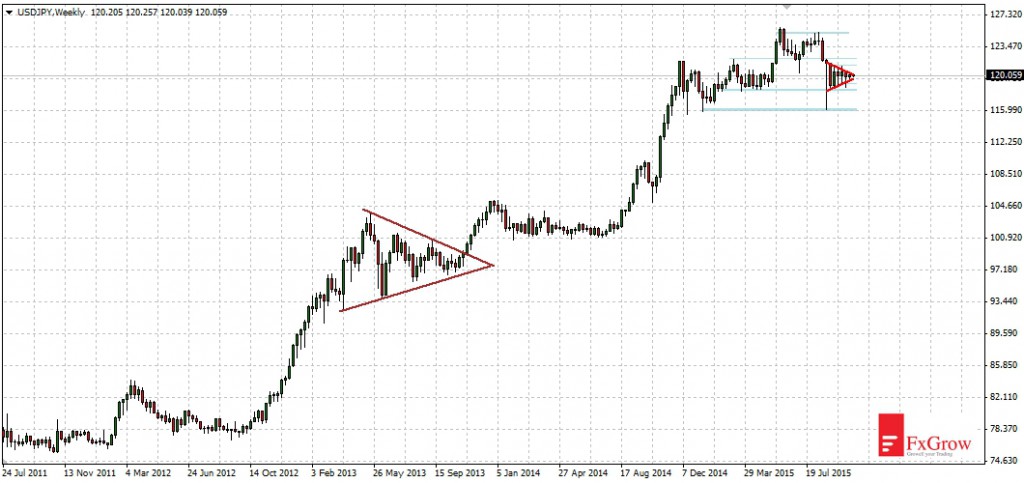
Wider view, interval W1
Since 4 years USDJPY moves in upward trend and it is more possible that the main trend will be continue. What is interesting, on weekly charts you can see that the previous consolidation has a shape of triangle and that ended in new high.


