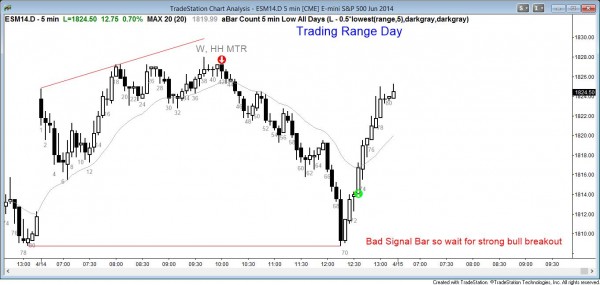
This chart shows prices from April 2014.
The exact rates are important, but the strategy that Al Brooks is trying to describing is vital when learning about weak signals and the strong breakout that they need.

The market had a strong bull breakout from bar 12 to bar 18 and was clearly always In “long mode”.
Although the market had a “higher high major trend reversal top2 with a short entry below bar 29, the momentum up was strong enough that the market was more likely to continue in the trading range that began at bar 19.
However, most major trend reversals have about a 40% probability of success so are considered reasonable setups.
If a bear sold below bar 39, his stop would have been above the bar 28 high, risking 2 points.
He could have waited for a second entry, which came as the market fell below bar 41. A second signal usually has a higher probability of success. If the day trader managed his trade well, he might have taken 16 points profit as the market reversed up above bar 70 after forming a double bottom with yesterday’s low. The huge profit relative to the risk offsets the low 40% probability, making the Trader’s Equation positive for major trend reversals.
Trading strong momentum
Whenever a trader is looking to buy, but the momentum down is strong, he should wait for either a second entry buy signal or for a strong bull breakout.
The momentum down to bar 69 was so strong that the first reversal up was likely to be limited and the market was likely to test the bar 69 low.
However, because today was a “trading range day”, despite this strong selloff, traders were aware that this selloff might have been simply a sell vacuum test of yesterday’s low and it could become the low of the day.
Although bar 70 was a strong signal bar, it was not strong enough to reverse that final leg down and the odds favored sellers. Bulls wanting a higher probability would have waited for either a second entry buy signal, like a test of the bar 70 low, or for a strong bull breakout.
They did not get the second signal but most believed that the reversal up was so strong that higher prices were likely, and they began to buy closes starting at bar 72 or bar 73.
Price action tests after strong momentum
Because the market had so much momentum up to bar 18, it was likely to have at least a test of the bar 18 high after the first pullback.
This means that the first attempt to reverse the trend down below bar 19 would probably fail and the buyers would scale into longs below the bar.
Day Traders would expect a move at least back up to the bar 18 close.
This is because bulls were buying the strong bull closes. They were confident that the first pullback would fail and they therefore scaled in lower with a protective stop below bar 14 or bar 12.
Many then placed limit orders to exit their entire position at their highest entry, which was the bar 18 close.
This often means that there are many sell limit orders there, as there were today, and that the market will probably test down again and form a trading range.
The bulls get out of their highest entry (when the bought the bar 18 close) at breakeven and with profits from their lower entries. For example, they might have added to their position by buying more at the bar 18 low or 1, 2, or 3 points below the bar 18 close.
If they did, they would have a profit from their lower entries. They averaged in to increase their probability of making a profit, but they have to give something to get something. What they give is higher risk…a larger position with a protective stop further away than what they normally use.
Original post was published at Al Brooks Price Action Trading Blog. Check Brooks Trading Course and get The most comprehensive source of information on price action trading available!


