EURUSD
For consecutive week the market continued a downward trend. If we look at the daily chart we note that each of the ten consecutive last candles are on the supply side. For a long time we didn’t have a such a strong ongoing trend
Looking at the weekly chart, we see that the market is currently found in the area of extremely important support 1.0600 coinciding with the line of upward trend. Overcoming this level could open the way to declines, at least in the vicinity of 1.0480, while if this support is also broken, we can expect continuation of declines in a much longer period.

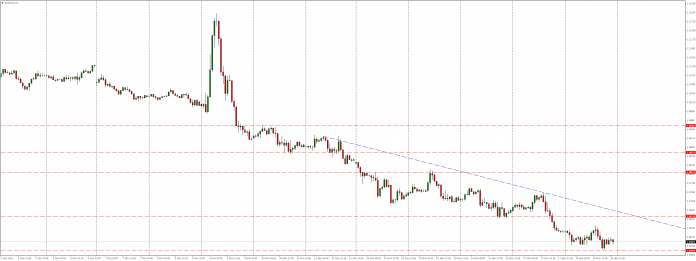
On the H1 chart we see that the to consider that declines are over it would be necessary to overcome the level 1.0671 coinciding with the downward trend line. As long as it doesn’t happen, I’d be wary of opening long positions.
GBPUSD
Since last Friday, on this currency pair we observe declines. From Tuesday to Thursday we saw a correction in the form of a triangle, where the upper limit coincided with the level of 38.2% Fibonacci correction, and which according to my previous prediction has been broken thru the bottom.
Currently we continue to re-test the 1.2362 level, but from a technical point of view the potential upward correction could reach even around Tuesday’s lows – 1.2380, which coincide with 38.2% Fibonacci measurement of ongoing since Thursday declines.

USDCHF
As a result of the ongoing for two weeks firm strengthening of the US dollar ,market overcame the resistance 1.0000 and reached the vicinity of local supply area , which defeated could pave the way for growth even in the vicinity of level 1.0242 or even 1.0297.
However, if in the near future we see the reactions from supply side, the immediate support for the price should be mentioned already level 1.0000.

USDJPY
USDJPY for few days is the focus of many traders and investors. All this thanks to the unrelenting demand strengthening US dollar.
Although gains on this pair last from 27 September 2016, however dynamics gained scarcely at the beginning of November. From the time when the results of the presidential elections in the US caused defeat of the 105.35 level, there was no resistance to be able to stop this train. Even very important level 107.60 was defeated without the slightest problem.
Currently, we are approaching the resistance area around 111.25 level, where we can expect the emergence of a strong supply response.

Looking at the H1 chart we notice that the market for several days is moving in the growth channel and to talk about a potential change of market sentiment ,we would require breaking the bottom line as well as overcoming local support 109.70 coinciding with the level of momentum 50% correction Fibonacci of the last growth impulse .


 Review")


