At the H4 chart OIL.WTI is a noticeable trend, evidenced by a sequence of increasingly higher highs and lows. An additional tool to help determine the trend are moving averages EMA on H4 (75- and 100-periodic), which are directed upwards. Most of the time the price is above said averages. You will notice that the test of resistance around the level of 51.50 USD, led to correction of recent increases.
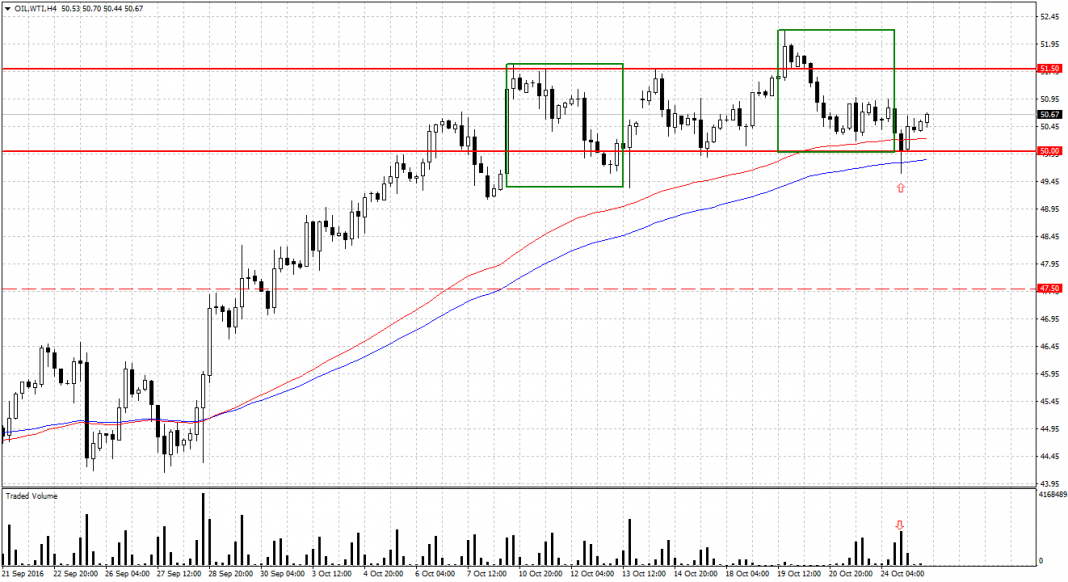 Declines tested support below the round level of $50.00. At this point you could see the price fall below the ascending band of EMAs and the similarity of adjustments (green rectangle). Yesterday’s candle during a test support, showed demand pressures (in conjunction with real volume). The candle was closed above $50.00. Currently we see increased demand, which supports the growth impulse. Resistance is located around US $51.50. In case of breaking the previously mentioned resistance this zone will serve as a support, while quotations of OIL.WT will open the way for further growth.


 Review")


