This week I analysed two currency pairs, the British pound and the New Zealand dollar in relation to the US dollar. In both cases I predicted the direction in which the price will go by analysing the Inside Bar formations that appeared on the daily charts of these instruments.
GBPUSD 01-05.10.2019
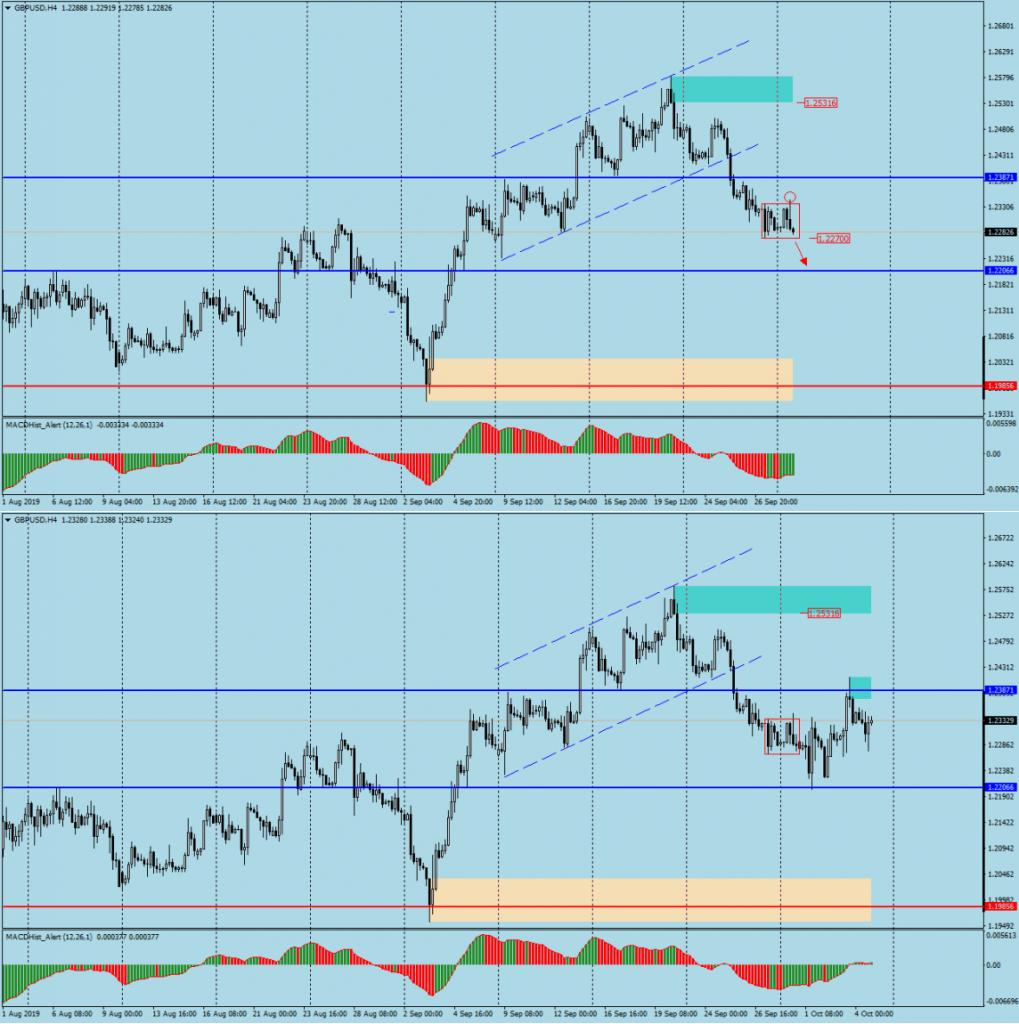
On this pair on Monday I noticed a fake breakout from the IB. I wrote this:-“On chart H4 an Inside Bar formation was formed, from which an attempt to break up was a false breakout. Currently the price is close to the bottom edge of the pattern and a possible breakout through the bottom may lead to further declines. It is possible that this week we will see the pair’s quotations around 1.2210.”
On the comparative charts above you can see that the forecast has worked out to within a few pips.
NZDUSD 03-05.2019
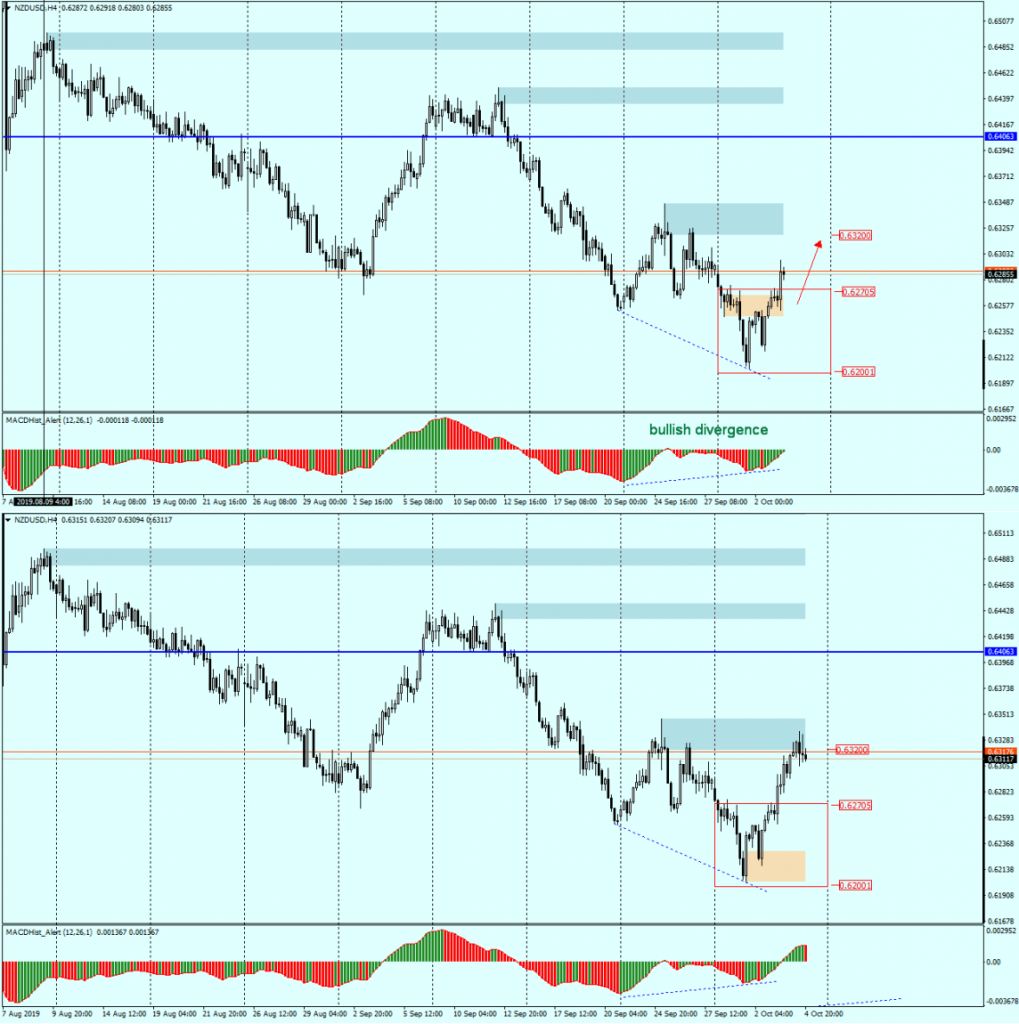
Here, too, we had the Inside Bar pattern and when I did my analysis on Wednesday, the price had already gone up. I wrote this: “…there are signs of an upward correction this week. Daily candles from Tuesday and Wednesday formed the Inside Bar pattern, and today’s candle indicates a breakout from the pattern. On charts D1 and H4 there are growth divergences, which additionally supports the bullish scenario. Buyers are likely to target the nearest supply zone starting at 0.6320…“.
The price exceeded the predicted level of 0.6320 by 15p, followed now by decreases. Friday’s session ended at 0.6210. Maybe it will
re-test the defeated IB resistance (0.6270), but the next week may also turn out to be bullish and the price will reach 0.6360 as divergence continues in Chart D1.

In our Facebook group, which you can join anytime: https://www.facebook.com/groups/328412937935363/ you will find 5 simple strategies on which my trading is based. There, every day we post fresh analyses of currency pairs and commodities


 Review")


