The 40th week of this year, and especially its last two days, has brought abnormal volatility to the British pound (GBP) and pairs associated with it. The weekly candle on the cable is the largest of its kind this year, at above 500p, and announces further increases next week. Undoubtedly, this sudden recovery has resulted in recent talks between the Irish and UK Prime Ministers and a convergence of backstop positions between Ireland and Northern Ireland. Additional impetus for growth was provided by today’s EU communiqué that talks on the brexit agreement will be intensified, which raised hopes for the UK’s exit from the EU with a deal.
This week, in view of UK’s upcoming exit from the EU and in anticipation of surprising movements in the European currency market, I paid more attention to pairs from the antipodes.
This week I have analysed Australian (AUD) and New Zealand (NZD) dollars in pair with US dollar.
AUDUSD 07-11.10.2019
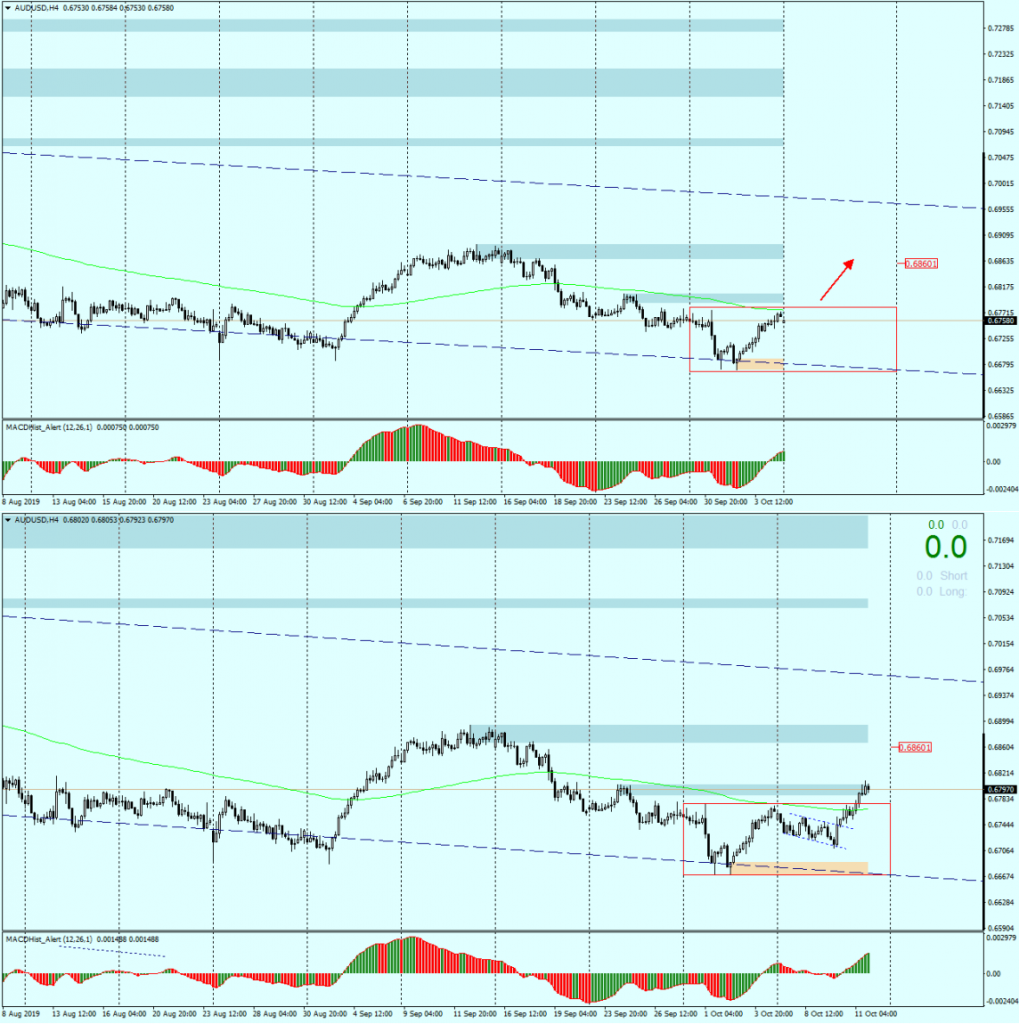
Analyzing AUDUSD on Monday, I was expecting increases based on Inside Bar pattern and divergence on a daily chart. I wrote this: “Looking at the AUDUSD from a purely technical point of view, we can see that last week there were attempts to correct the recent declines. The range of Monday’s day candle turned out to be unbeatable for the following days, the Inside Bar pattern was created. It is very likely that the price will leave the formation heading north. This scenario is supported by bullish divergence on D1.
As can be seen from the above comparison chart, the price is already outside the IB area, but so far the movements are quite limited and 60p are still missing to the 0.6860 level planned in the analysis.
XM offers traders accounts with minimum deposits from $5 and security through CySEC, ASIC and FCA licenses. Trade with a broker with 10 years of market tradition and more than 2.5 million clients worldwide
NZDUSD 09-11.10.2019
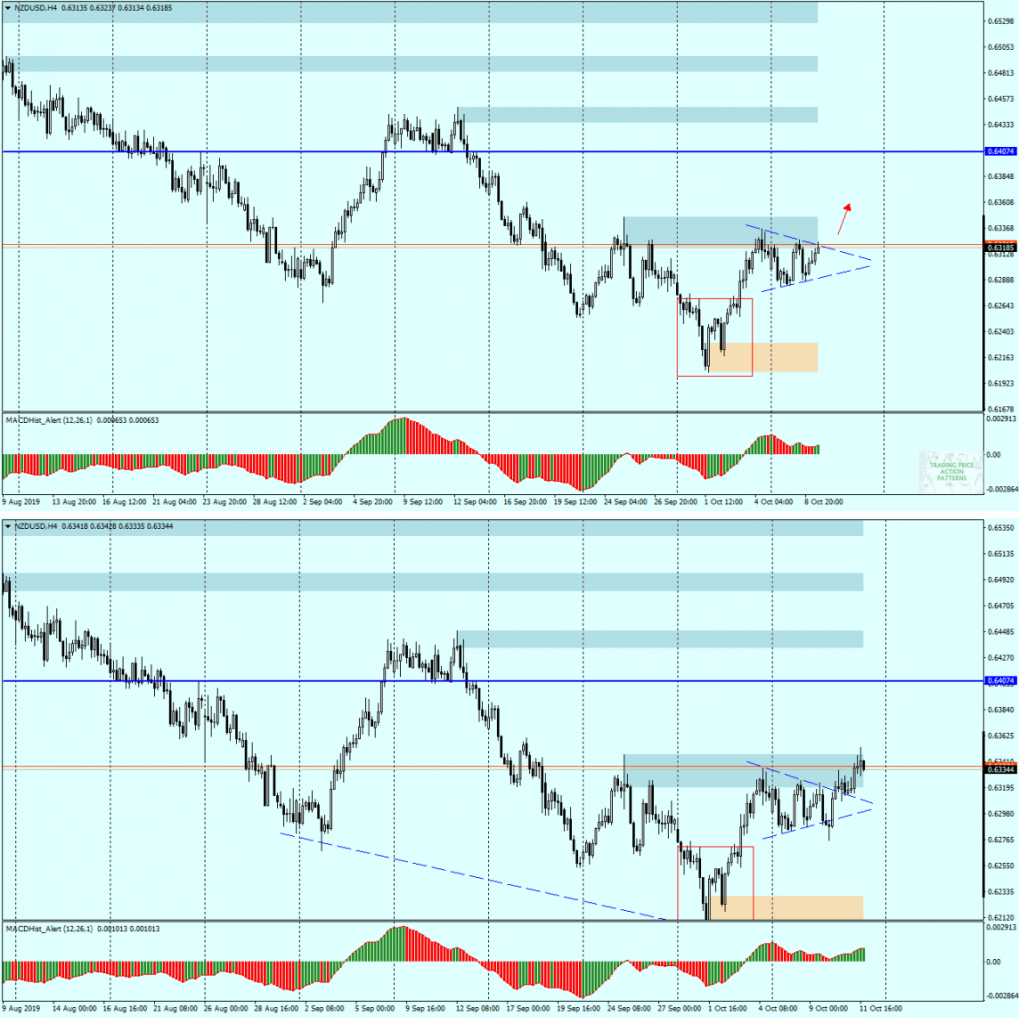
On Wednesday, I took a look at the second pair from the antipodes – NZDUSD. Here I saw a Price Action formation – a symmetrical triangle. I wrote this way: “If we look at H4 chart, we will notice that the quotations formed a symmetrical triangle pattern, from which it is very probable that the top will be broken. Overcoming the resistance of the triangle will be tantamount to overcoming the supply zone. The upward scenario is supported by upward divergence in the daily chart.
Here, similarly as in the previous analysis, I based my prediction of the northern direction of the breakout on bullish divergence in the daily chart. However, before this breakout occurred, the market tested the support of the triangle to create a false breakout.
Summing up the above analyses, it seems that in both cases the direction will be continued next week as we still have upward divergences in the daily charts.

In our Facebook group, which you can join anytime: https://www.facebook.com/groups/328412937935363/ you will find 5 simple strategies on which my trading is based. There, every day we post fresh analyses of currency pairs and commodities


 Review")


