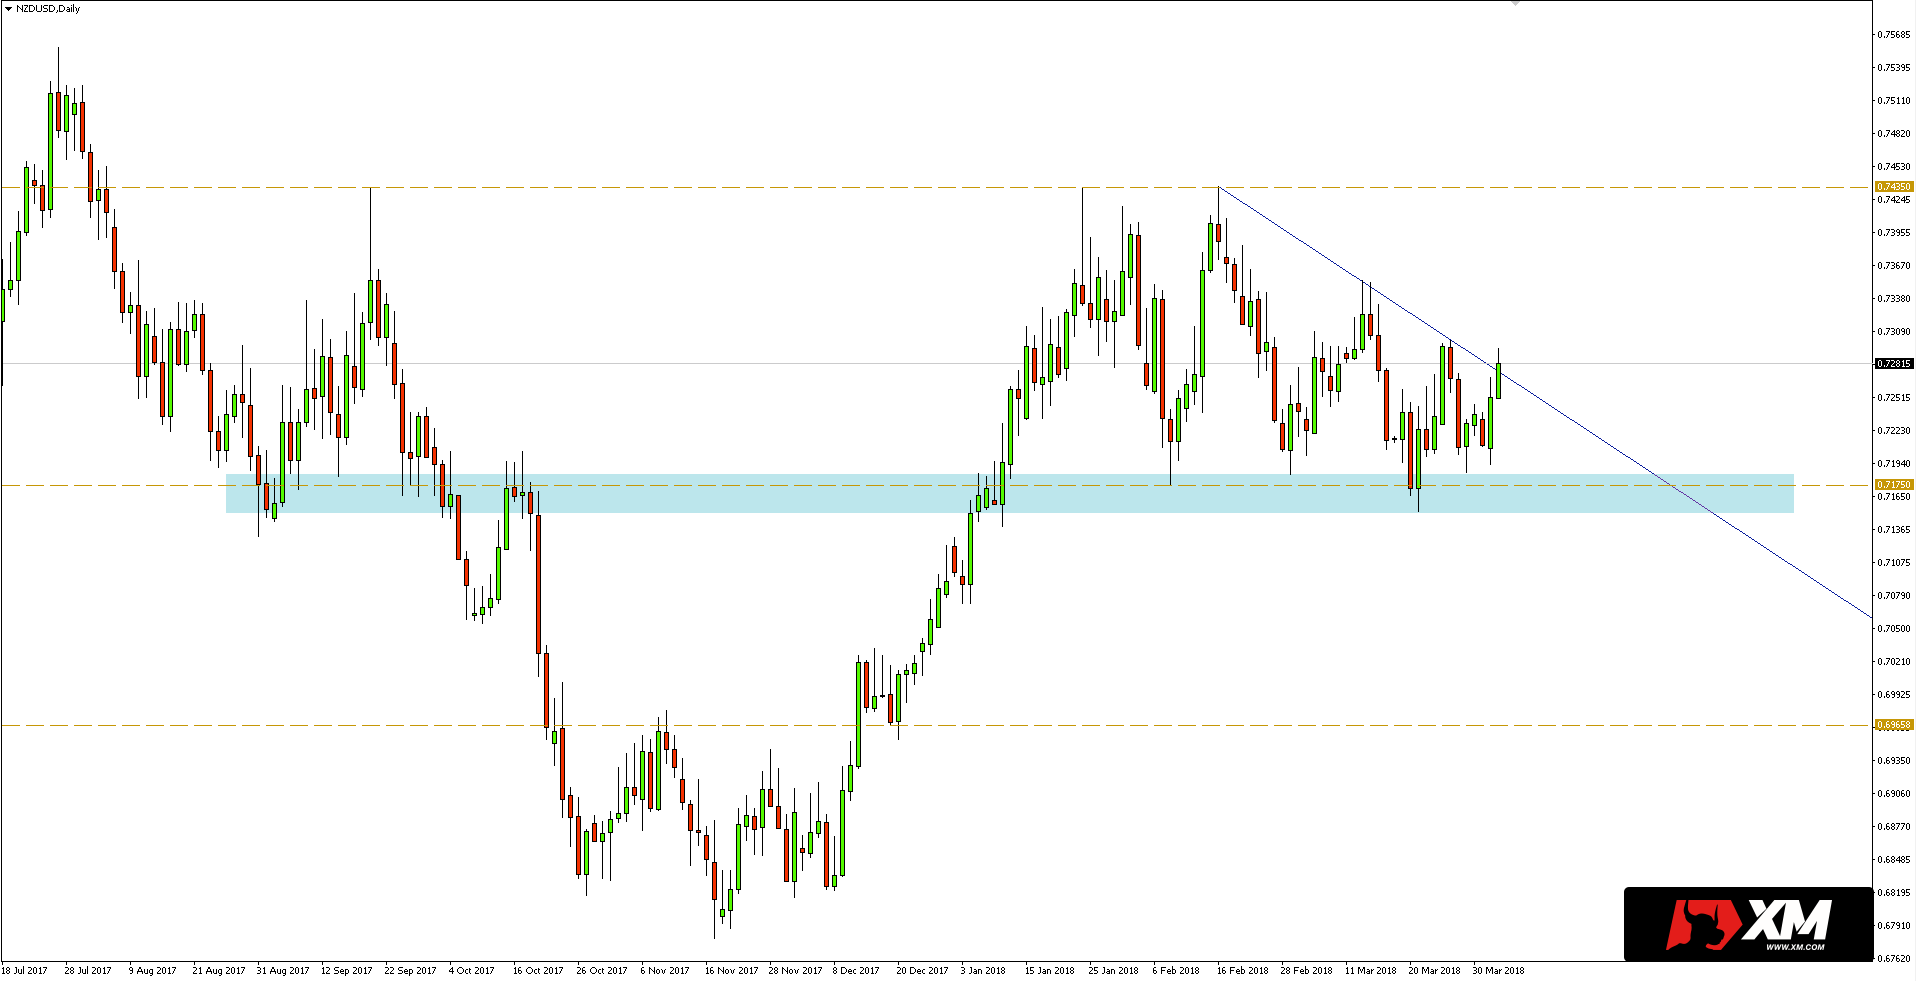
NZDUSD has been trading almost since the beginning of the year in the area between key resistance at 0.7435 and support at 0.7175. In addition, since the rebound, from the range upper limit, the price stays below the downward trend line shown in the daily chart below.
 I trade on this instrument at broker XM, which has in its offer more than 300 other assets >>
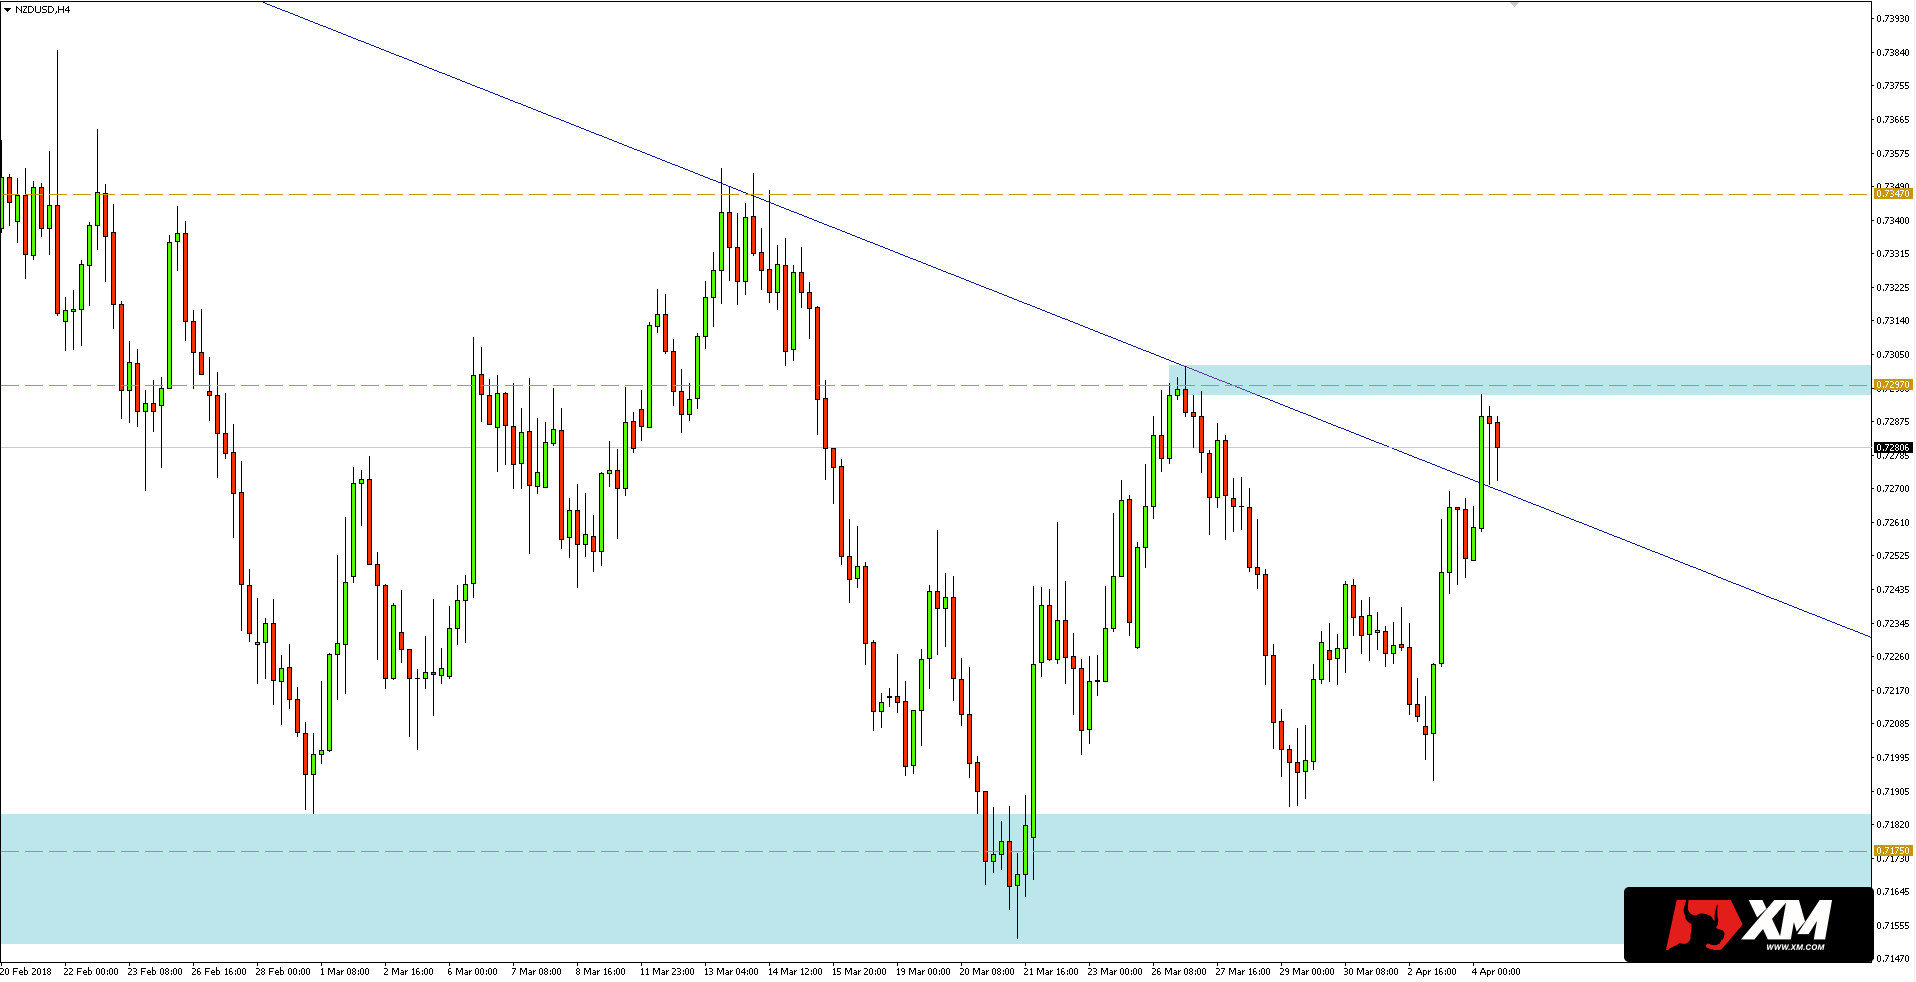
The aforementioned trend line has already been broken down in the H4 chart, but the confirmation will be only when closing above on daily interval. In addition, the pair has to face a short-term resistance close to 0.7297.Breaking local resistance will open the way for increases towards 0.7347. On the other hand, after overcoming this barrier, quotations may continue to reach the upper limit of the range at 0.7435, mentioned on the beginning. Alternatively, I will consider speculation about the weakening of NZDUSD after the effective breakdown of the support range under 0.7175 / 52.


 Review")


