GBPCHF – the pair from April this year moved in a downward trend. On the last day of August, it set a minimum of this year at 1.2455. In September, there was a clear revival of quotations, ATR already reached the value from before the holidays and candles with the range above 200p appeared. The last session of September (Friday) is included in Thursday’s creating the formation of Inside Bar.
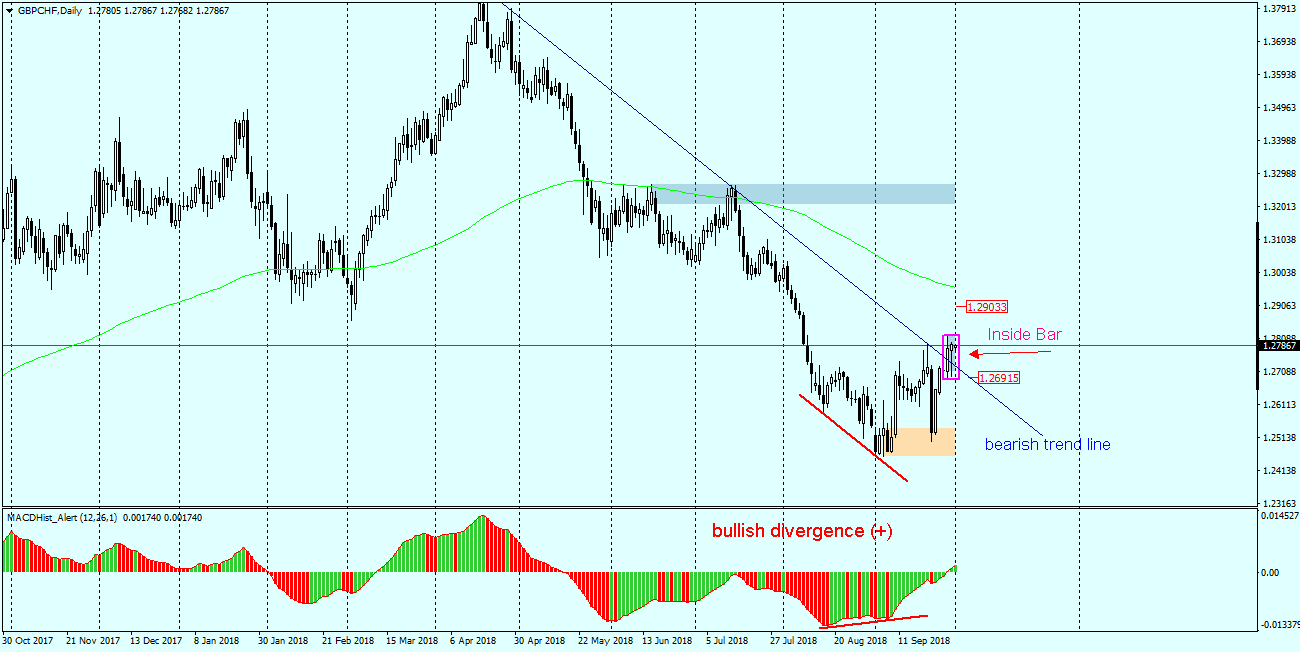
Currently, the price is above the line of the downtrend mentioned at the beginning and it seems that this breaking can be considered as confirmed by the long bottom shadow of Friday’s daily candle. On the D1 chart, we also notice the ongoing (+) bullish divergence. Taking into account these two factors, it is possible to expect further increases.

On the H1 chart, we can look for a signal to enter Long. You can search for entry at the beaten trend line or wait for a confirmed IB outbreak. The Inside Bar is nothing but a local consolidation … so knocking out of it usually gives an impulse to continue the movement in accordance with the direction of the outbreak. The natural level of the Stop Loss will be around the lower edge of IB – 1.2690 and the nearest TP 1.2900. As you can see from the levels it is a “fast” pair and when planning a trade it is worth thinking about reducing the volume by half from the usual rate.


 Review")


