NZDCAD 17/01/2019

A pair of commodity currencies – NZDCAD, largely dependent on exports and prices of raw materials such as oil, iron ore, aluminium and petroleum products. For the last 5 years, the pair has been moving in a large consolidation with a range of about 1500 pips (graph at the top). Currently, the price is approaching the axis of this consolidation (0.8915) and MACD points to the possibility of continuing the declines, which began at the beginning of December last year.
On the Daily chart (below) we can see the formation of Head and Shoulders formation, where the neck line coincides with the axis of the mentioned consolidation. Overcoming this level (0.8915) may give an impulse for further declines. The nearest demand zone, starting at 0.8880 may be the goal of supply. Next is at 0.8680,
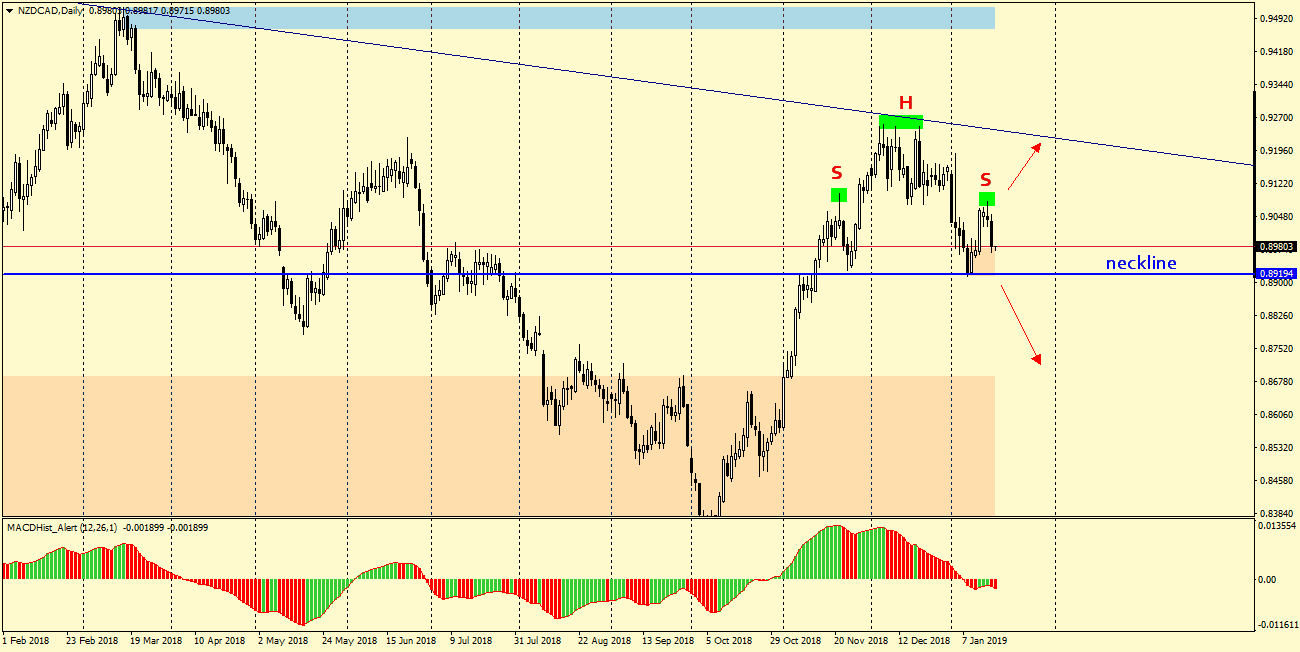
Conservative trader’s version: We may consider placing a sell order only after the neck line has been crossed and it would be best if retested from the bottom.
For risk aficionados: enter the sell now and place a stop loss above the right shoulder (0.9080). Overcoming the right arm of the H&S can completely change the situation on this pair and signal the northern direction.


 Review")


