 The famous investor Warren Buffett used to say “price is what you pay. Value is what you get”. All investor would like to pay as little as possible for the value received. For this purpose, it is necessary to examine what is the difference between the intrinsic value of a given share compared to its market valuation, i.e. simply a stock exchange rate.
Valuation approaches and methods
There are three main approaches used in valuation. They are all based on the economic principles of price equilibrium, anticipation of benefits or substitution. The principal valuation approaches are:
Market Approach is to value the company by comparing it to trading multiples of similar public companies. The second method of market approach is to compare to precedent transactions of similar assets or businesses.
Income Approach consists in creating a financial model that will forecast future revenues, costs, investments, etc. and on its basis future cash flows are determined which are used to determine the value of a given company.
Cost Approach is valuation that surmises that the price a buyer should pay for assets or business should equal the cost to build similar assets or business. There are two methods of cost approach, replacement costs and reproduction costs. The difference between these methods in short is that the cost of replacement method is estimated in accordance with current technology. In reproduction costs method, we estimate the production cost of given asset and the degree of its deprecation at present.
Asset-Based Approach focuses only on accounting entries and determination of net assets value (NAV), it means assets minus liabilities.
We will focus on the two most popular equity valuation methods, i.e. the market and income approach. The approach market methods are simpler to the income method, of course, if we find comparable companies. Nevertheless, the income approach is more popular, although it is a very subjective method.
Market approach
One of the method of market approach consists in finding a group of similar companies, calculating trading multiples for them and, on their basis, making a valuation of the company we are investigating. Companies that will be used to quote our company should:
- be in the same industry,
- be of similar size,
- perform similar activities,
- use similar technologies,
- have a similar level of debt, etc.
The steps we should take when using the multiples method are as follows:
- finding a group of companies similar to the company being valued (at least 3, but not too much, because the companies will not be too similar to each other),
- selection of indicators (at least 2, there is no model indicating which multiples should be used, but most often P/E and EV / EBITDA are used),
- selection of the period from which the financial data originates (the comparative method is a static valuation, i.e. the financial data used for the valuation come from previous years, usually from 12 months), however, recently you can see an attempt to increase the dynamics of this method by using forecasted financial data for 2-3 years),
- determination of weights for particular multiples,
- determination of the premium or discount of the company being valued in relation to a selected group of companies (making adjustments due to liquidity and control),
- company (stock) valuation.
Types of multiples
There are two types of multiples:
Equity Value are indicators that focus on the values belonging to the owners:
- P/E (Price/Earnings) shows the ratio of the current market price (capitalization) to the obtained net profit.
- P/BV (Price/Book Value) shows the relationship between the company’s market price and the book value, or the net asset value. The indicator below 1 means that the market value of the company (capitalization) is smaller than its book value.
- P/S (Price/Sales) shows the relation of the price to sales revenues.
Enterprise Value (EV) are multiples focusing on equity and debt:
EV = Equity + Net Debt (Net Debt = Long-Term Debt + Short-Term Debt – Cash and Cash Equivalents)
- EV/EBIT (Enterprise Value/Earnings Before Interest and Taxes) shows the ratio of invested capital to operating profit.
- EV/EBITDA (Enterprise Value/Earnings Before Interest, Taxes, Depreciation and Amortization) shows the ratio of invested capital to operating profit before deducting depreciation and amortization.
EBITDA = EBIT + Depreciation and Amortization
- EV/S (Enterprise Value/Sales) shows the ratio of invested capital to revenues from sales.
Premium and discount in the company’s valuation
Adjustments in the form of premium and discounts are used for reasons of liquidity, i.e. the ability to quickly buy or sell a company on the public market and for controlling the company, because valuating a listed company, we estimate shares available in free float, not a controlling shareholding which often remains in the company’s founders.
Applying premium and discount for the lack of liquidity:
- valuation company and comparable companies from a public capital market – there is no need to apply a correction for illiquidity,
- valuation company and comparable companies from a private market – there is no need to apply a correction for illiquidity,
- valuation company from a public capital market and companies comparable to a private market – there is a need to take into account the higher liquidity of the assets valued in relation to comparable assets, liquidity premium,
- valuation company from a private market and companies comparable to a public capital market – there is a need to take into account the lower liquidity of the assets being measured relative to comparable assets, discount for liquidity.
Applying premium and discount for control:
- we provide a valuation of a controlling stake in the company being valuated and in comparable companies – there is no need to apply a correction for no control,
- we provide a valuation of a minority stake in a valuated company and in comparable companies – there is no need to apply a correction for no control,
- we provide a valuation of a controlling stake in a valuated company and a minority stake in comparable companies – there is a need to apply a control premium,
- we provide a valuation of a minority stake in a valuated company and a controlling stake in comparable companies – there is a need to apply a discount for not having control.
Valuation of business
The formula for the company’s valuation:
V = M x B
V – company value
M – multiples
B – basis, e.g. EBIT, EBITDA, net profit, revenue, etc.
We select the base for the indicator used, for example using the P/E, the base will be the net profit of the company being valued, using the EV/EBIT, the base will be the EBIT of the company being valued.
An example of the valuation of ABC by the multiples method
The valuation of ABC as at 31/12/2017. The company, which we are trying to value, is a real estate development with an established position on the market. The company has been operating since 1995. The company has been listed on the stock exchange since 2005. The developer invests mainly in the housing market.
Shares Outstanding: 22 500K
Stock price: 30
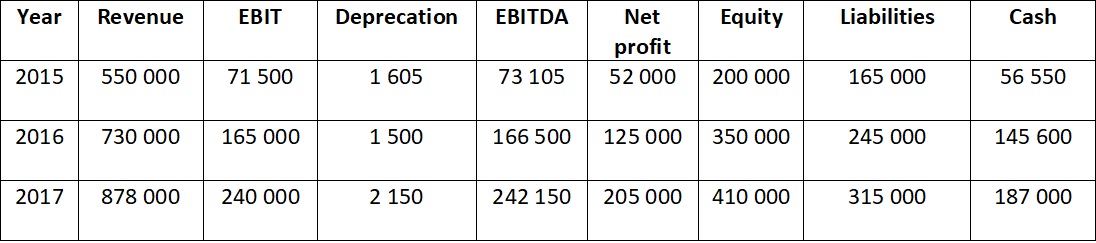
Financial data of the company for the years 2015-2017 in thousands.
Comparable companies
The DEF company has been operating on the development market since 1993. The company has been listed on the stock exchange since 1997. The company operates on the housing market.
Shares Outstanding: 400 000K
Stock price: 5
EV in 2015 = 205 000
EV in 2016 = 205 000
EV in 2017 = 205 000
EBITDA in 2015 = 95 600
EBITDA in 2016 = 122 300
EBITDA in 2017 = 137 400
EPS in 2015 = 0,2
EPS in 2016 = 0,56
EPS in 2017 = 0,34
The company GHI has been operating on the development market since 1979. The company has been listed on the stock exchange since 1998.
Shares Outstanding: 15 000K
Stock price: 31
EV in 2015 = 925 000
EV in 2016 = 925 000
EV in 2017 = 925 000
EBITDA in 2015 = 401 140
EBITDA in 2016 = 332 400
EBITDA in 2017 = 376 000
EPS in 2015 = 2,18
EPS in 2016 = 4,3
EPS in 2017 = 4,79
The company JKL has been operating on the development market since 2001. It focuses mainly on the housing market. The company has been listed on the stock exchange since 2007.
Shares Outstanding: 55 000K
Stock price: 11
EPS in 2015 = 2,17
EPS in 2016 = 2,7
EPS in 2017 = 2,2
EV in 2015 = 23 400
EV in 2016 = 23 400
EV in 2017 = 23 400
EBITDA in 2015 = 146 000
EBITDA in 2016 = 161 400
EBITDA in 2017 = 169 300
Calculation of multiples
Two most popular P/EPS and EV/EBITDA were selected for the valuation. Indicators can be found on some portals devoted to investing, or you can calculate yourself on the basis of the financial statements.
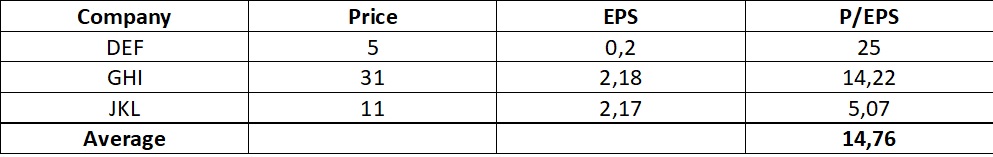
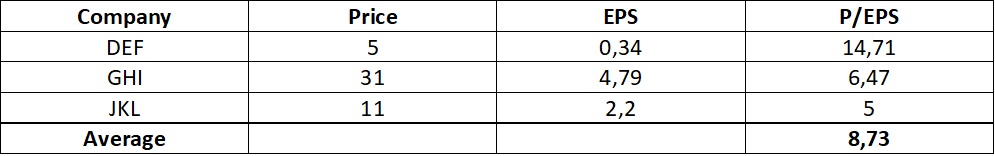
P/EPS
2015
 2016
2016
 2017
2017
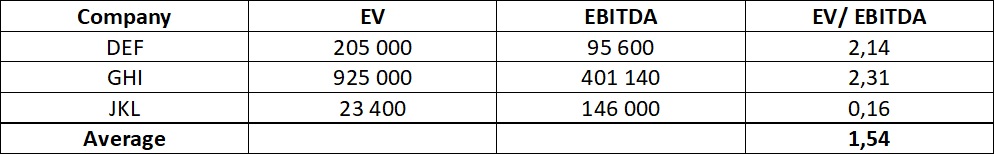
 EV/EBITDA
2015
 2016
2016
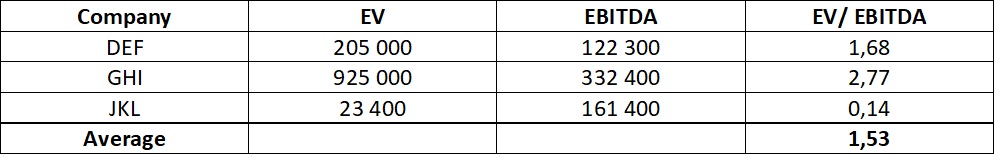 2017
2017
 Discount and premium
There was no need to apply a discount or premium due to the level of liquidity or lack of control.
Valuation of the company
P/EPS
Multiple – P/EPS in 2015-2017
Basis – net profit in 2015 -2017
V = M x B
2015
V = 14,76 x 52 000/22 500 = 34,11
2016
V = 6,74 x 166 500/22 500 = 37,44
2017
V = 8,73 x 205 000/22 500 = 79,54
The valuation based on the P/EPS and the use of equal weights for all years is 50.36 per share (the valuation was divided by the number of shares, 22 500K, to get the price of one share).
EV/EBITDA
Multiple – EV/EBITDA in 2015-2017
Basis – EBITDA in 2015-2017
V = M x B
2015
V = 1,54 x 73 105/22 500 = 5,01
2016
V = 1,53 x 166 500/22 500 = 11,32
2017
V = 1,36 x 242 150/22 500 = 14,64
The valuation based on the EV/EBITDA and the use of equal weights for all years is 10.32 per share.
The valuation based on the EV/EBITDA related to the value of the entire enterprise, i.e. equity and liabilities. In turn, we are looking for the value of equity, so we have to deduct interest-bearing liabilities from this value, and add cash that is in the company’s possession, that is, adjust for net debt.
Net debt in 2017 = 315 000 – 187 000 = 128 000
Now, the net debt value should be divided by the number of shares, that is 128 000/22 500, which is equal c.a. 5.7.
The final valuation based on EV/EBITDA is as follows:
10,32 – 5,7 = 4,62
Final valuation of ABC company
After using equal weights for P/EPS and EV/EIBTDA, the final valuation is as follows:
V = (50.36 + 4.62) / 2 = 27.49
Summary
ABC is listed on the stock exchange at 30 per share. The multiples method allowed to estimate the value of the company at 27.49 per share, which means that the company is overvalued in relation to its internal value.


