OIL.WTI – I wrote about it in the analysis from December 26th, when a Price Action growth formation appeared – bullish engulfing or if you prefer “Outside Bar”. Then, on the Daily chart, appeared a bullish divergence supporting me in the belief that we can expect a correction which, with a continuing strong downward trend, was a rather risky assumption. Until the end of the year, the price of Texan oil was moving in a narrow consolidation and we did not see any increases, but also decreases were limited to the level indicated in that December’s analysis.
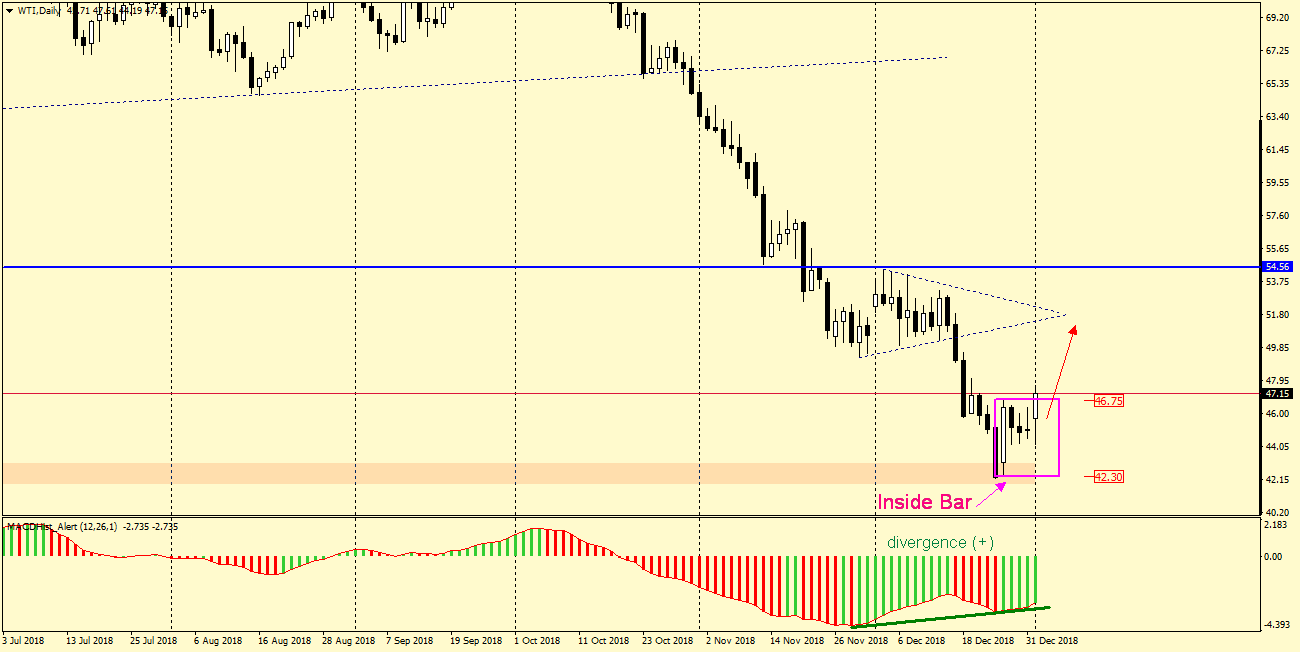
Today, the first day of trading in 2019 finally brought the expected upward movement and there was a breakout from the Inside Bar created by the daily candle of 26 December. The aforementioned divergence is also developing well, it’s already 5th day as the MACD is growing.
To sum up the above:
– bullish engulfing
– Breakout from Inside Bar
– bullish divergence on Daily chart
Those are at least three reasons for growth.
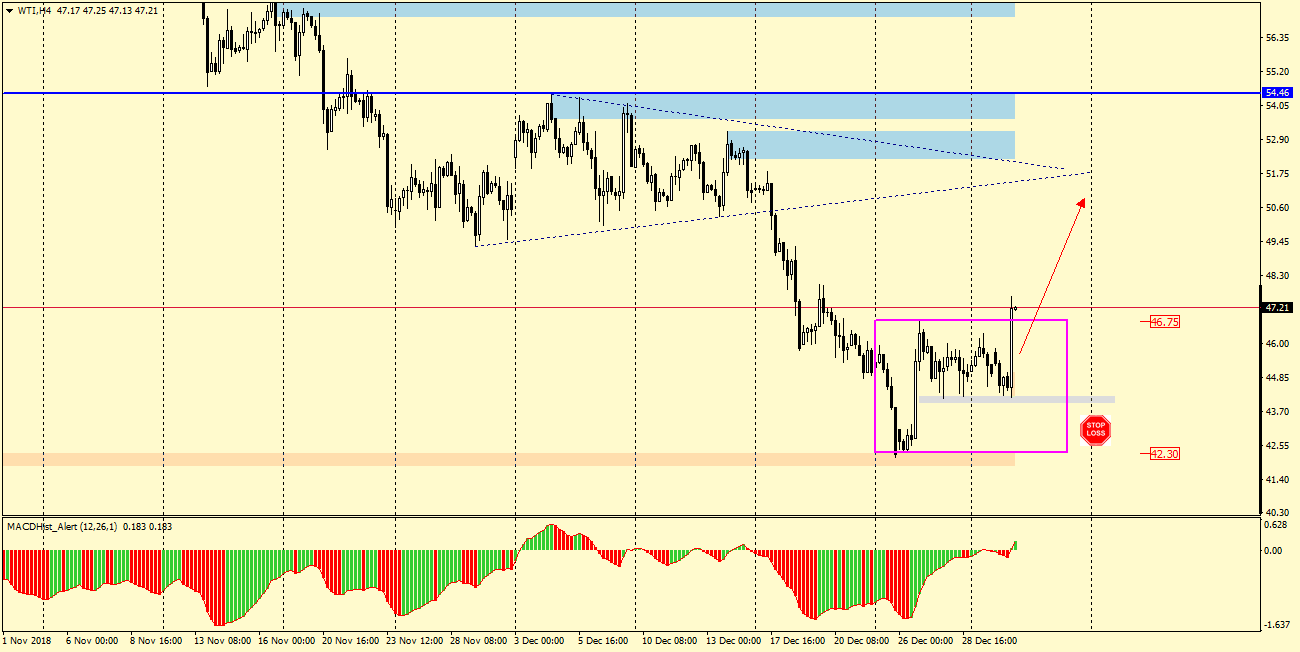
The range of such movement is at least the lower arm of the triangle, from which price broke down on 17 December with great impetus, currently located in the area 51.50. If the price turns back and ignores my prophecies… then SL should be placed below the minimum of today’s day candle – 43.90.


