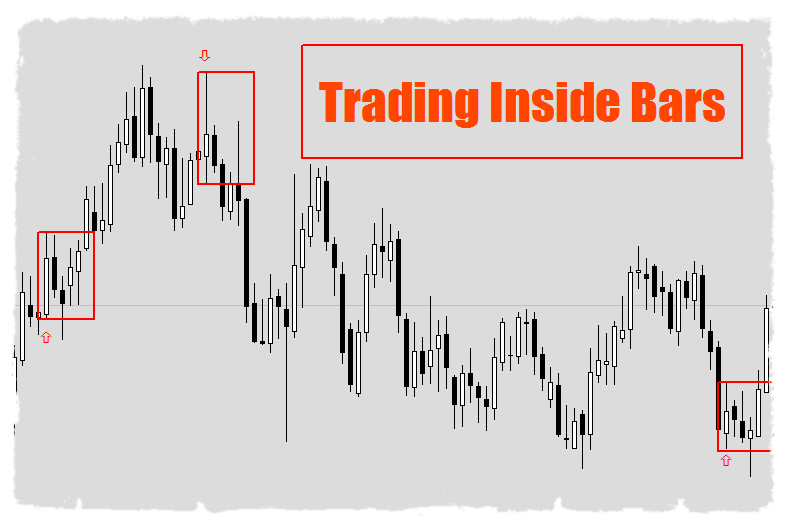
 Trading Inside Bars –under this heading you will find analysis made on basis of one of the most known Price Action formation – Inside Bar. Statistics show that best results gives breakout from Inside Bar formation on Daily chart, so mainly this time frame charts will be analysed.
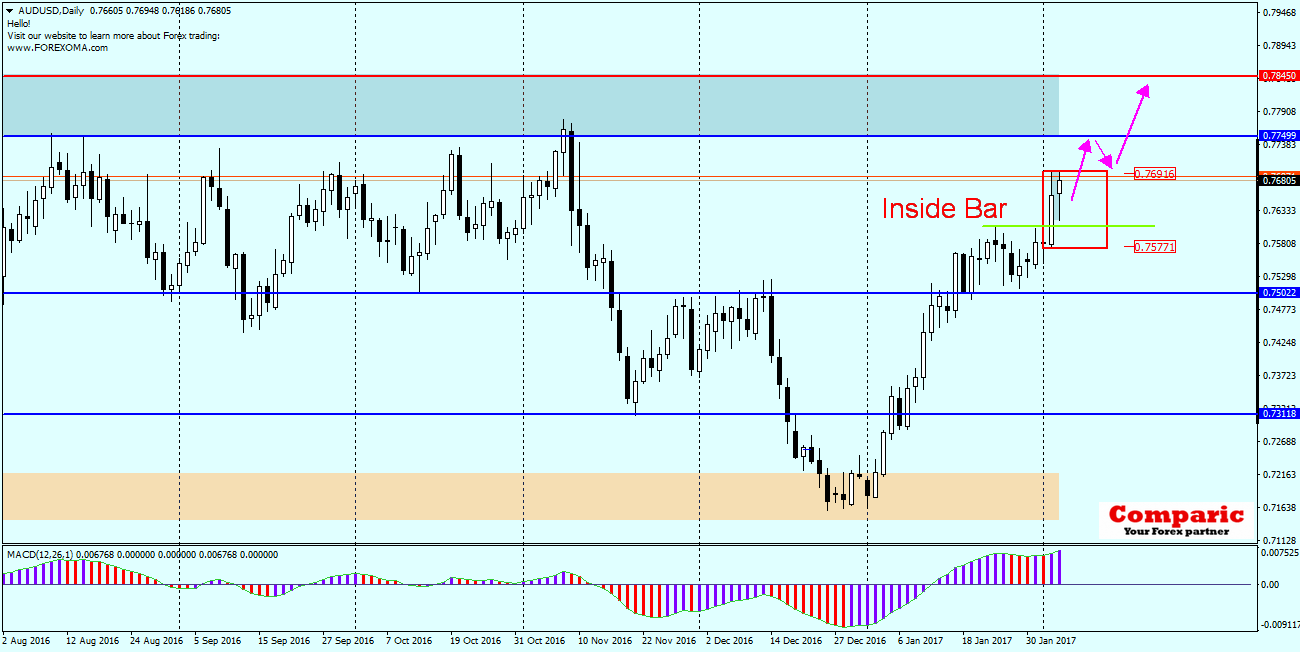
AUDUSD
AUDUSD is in a strong bullish trend from the beginning of the year. Last two daily candles set a Inside Bar formation (red box). We can expect a bullish breakout from the IB due to the lasting trend.
As shown on attached Daily chart, before a breakout possible is a pullback in area shown with green line. If such situation occurs- we should “hunt” for a Price Action Buy signal on lower time frame ( 15M-H4). Such a signal can be for example a candle with long lower wick. I would be cautious if price falls significantly lower than the said green line and would restrain from going Long expecting price to re-test the lower limit of IB.
Here you can check our analysis which gave over 250 pips
Dargo,04.02.2017 ,15:30


