Trading Price Action Formations –under this heading you will find analysis made on basis of most known Price Action formations – Inside Bar, Outside Bar, Head & Shoulders, Triangle, Wedge, Statistics show that best results give breakout from such formation on Daily chart, so mainly this time frame charts will be analysed.
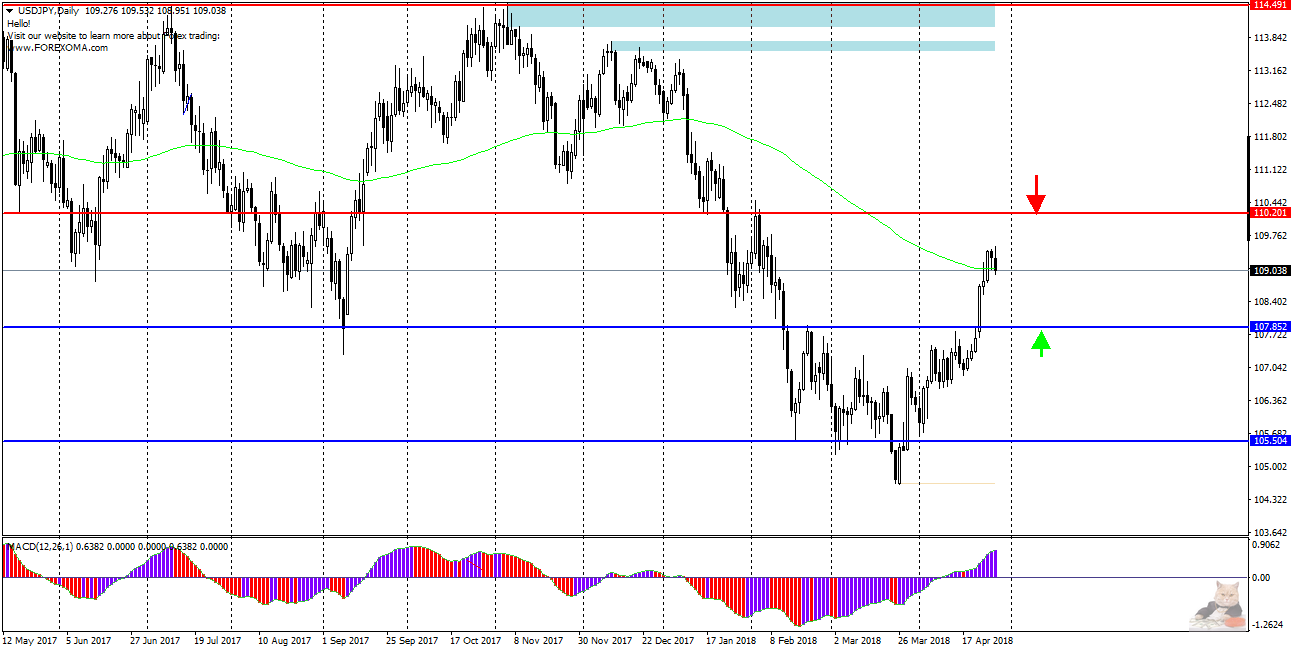
USDJPY – Inside Bar and Bearish Engulfing
USDJPY – on this pair there are actually some interesting Price Action candle formations.
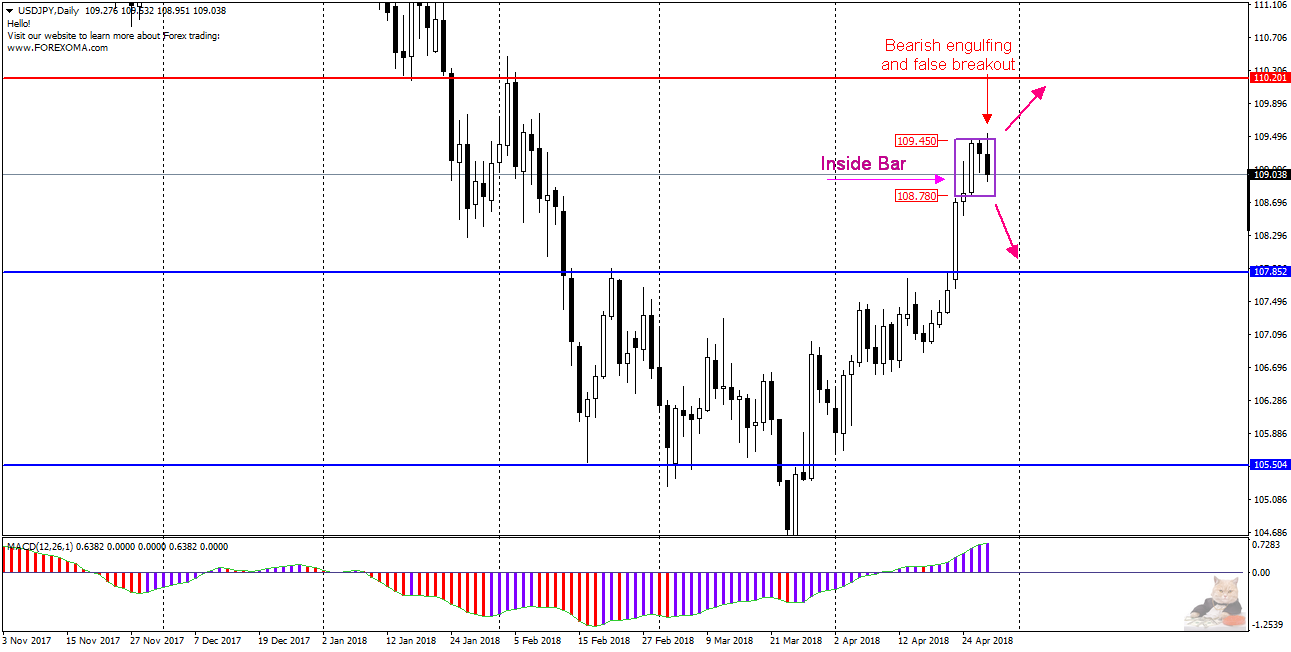
The first one is an Inside Bar created by a large bullish candle from 25.04, whose range 108.78-109.45 was not exceeded by the next daily (26.04). The Friday quotes of this pair did, to a small extent, break above the upper limit of the IB, but the closing of the week was already within its range, which means that we are dealing with a “false” breakout. What else is worth noting is the fact that the Friday candle completely covered range of previous candle , which additionally formed in this case bearish formation of Outside Bar, (bearish engulfing).
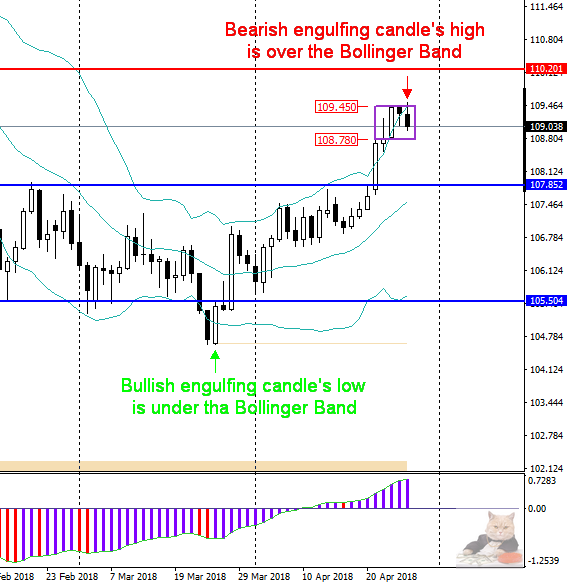 As I described the formation earlier – not every appearance of it results in decreases . The importance of the formation depends on where it appears. If the covering candle has its maximum above the upper bollinger band ( frankly saying high in relation to a dozen or so previous candles) then the probability of drops is high. On the chart next, I marked two formations from the Outside Bar family – the current one – the bearish engulfing and the previous from 26/03 bullish engulfing, which heralded increases.
Summing up, in the case of breaking out from IB thru the bottom, I expect a continuation of declines towards 108.00. If, however, a new attack on the level 109.45 (upper limit IB) occurs and is effectively defeated, the target may be 110.20