Monthly S&P500 Emini futures candlestick chart: Sell signal
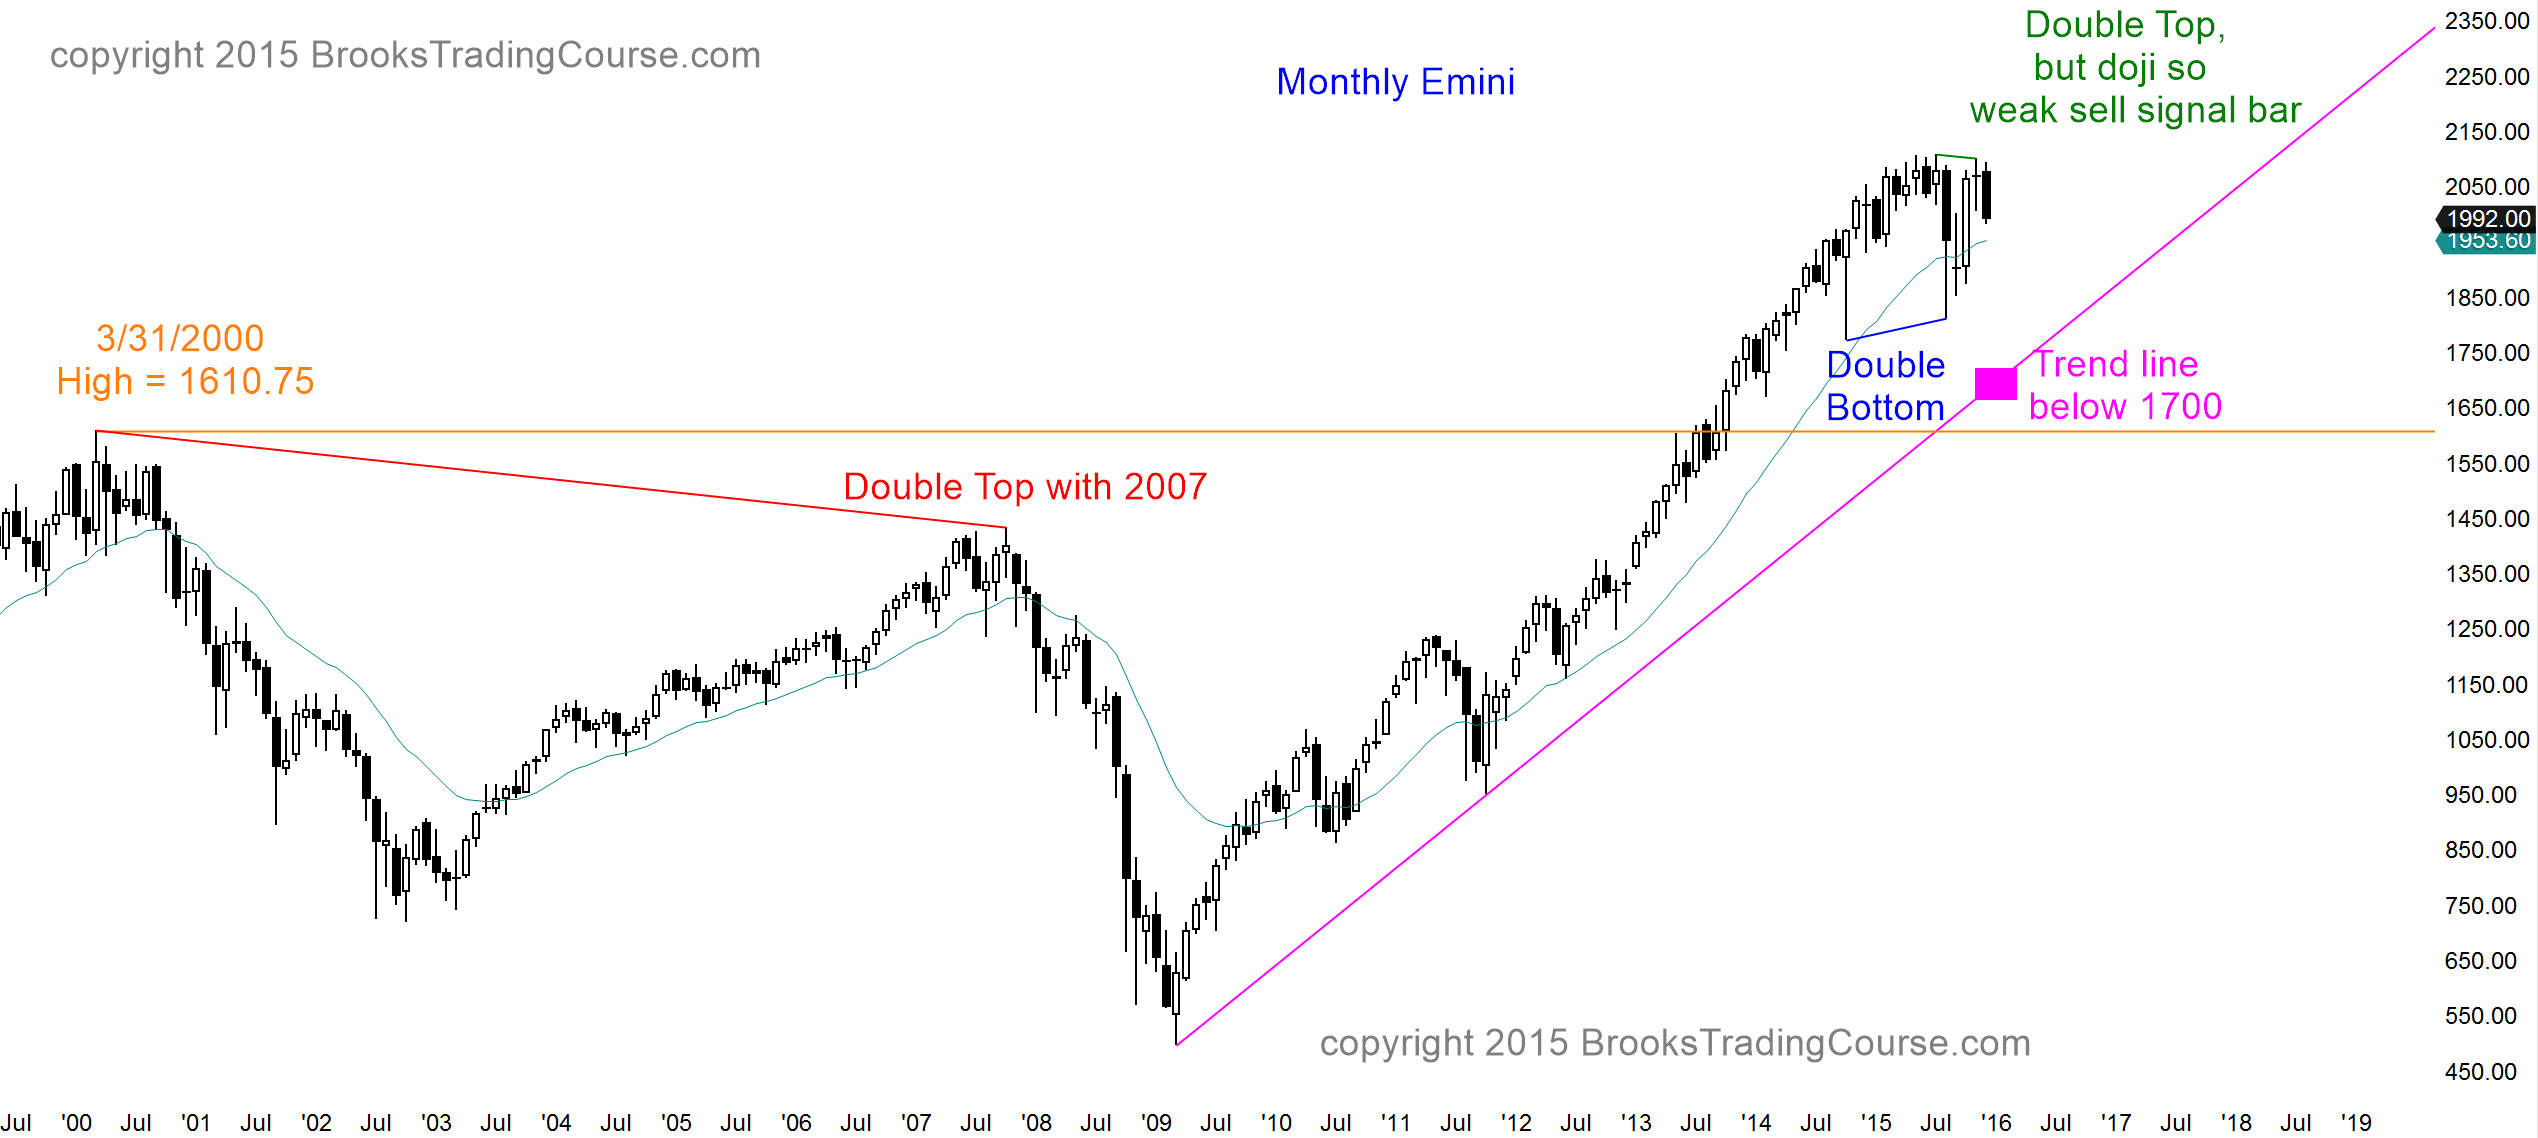
The monthly S&P500 Emini futures candlestick chart last month formed a double top with the all-time high in July. Because last month was as doji candlestick pattern, it was not a high probability sell signal. There are still almost 2 weeks left before the bar closes, and it is too early to know if this month will be a strong entry bar for the bears. If the Emini rallies in the final days of the month, there will be a big tail on the bottom of the candlestick bar, making it a weak entry bar for the bears who sold below last month’s weak sell signal bar. If instead it is a big bear bar closing on its low, the chance of follow-through selling next month will be higher.
The monthly chart has been overbought for about a year. It held above the 20 month moving average for 38 months. This has happened in the cash index only twice in the past 50 years. In 1987, it was followed by a 36% correction. In 1998, it was followed by a 22% correction. The sample size is small, but the two past occurrences should make those who trade the markets for a living be cautious.
Whether or not they know this history, they certainly know that the monthly bull trend has gone on for an unusually long time (6 years from the 2009 low). This is unsustainable price action and therefore climactic. Climaxes are often followed by reversals that are much deeper than what most traders think is reasonable. How deep is possible? Why not 20 – 30%, like the last 2 times it was this overbought?
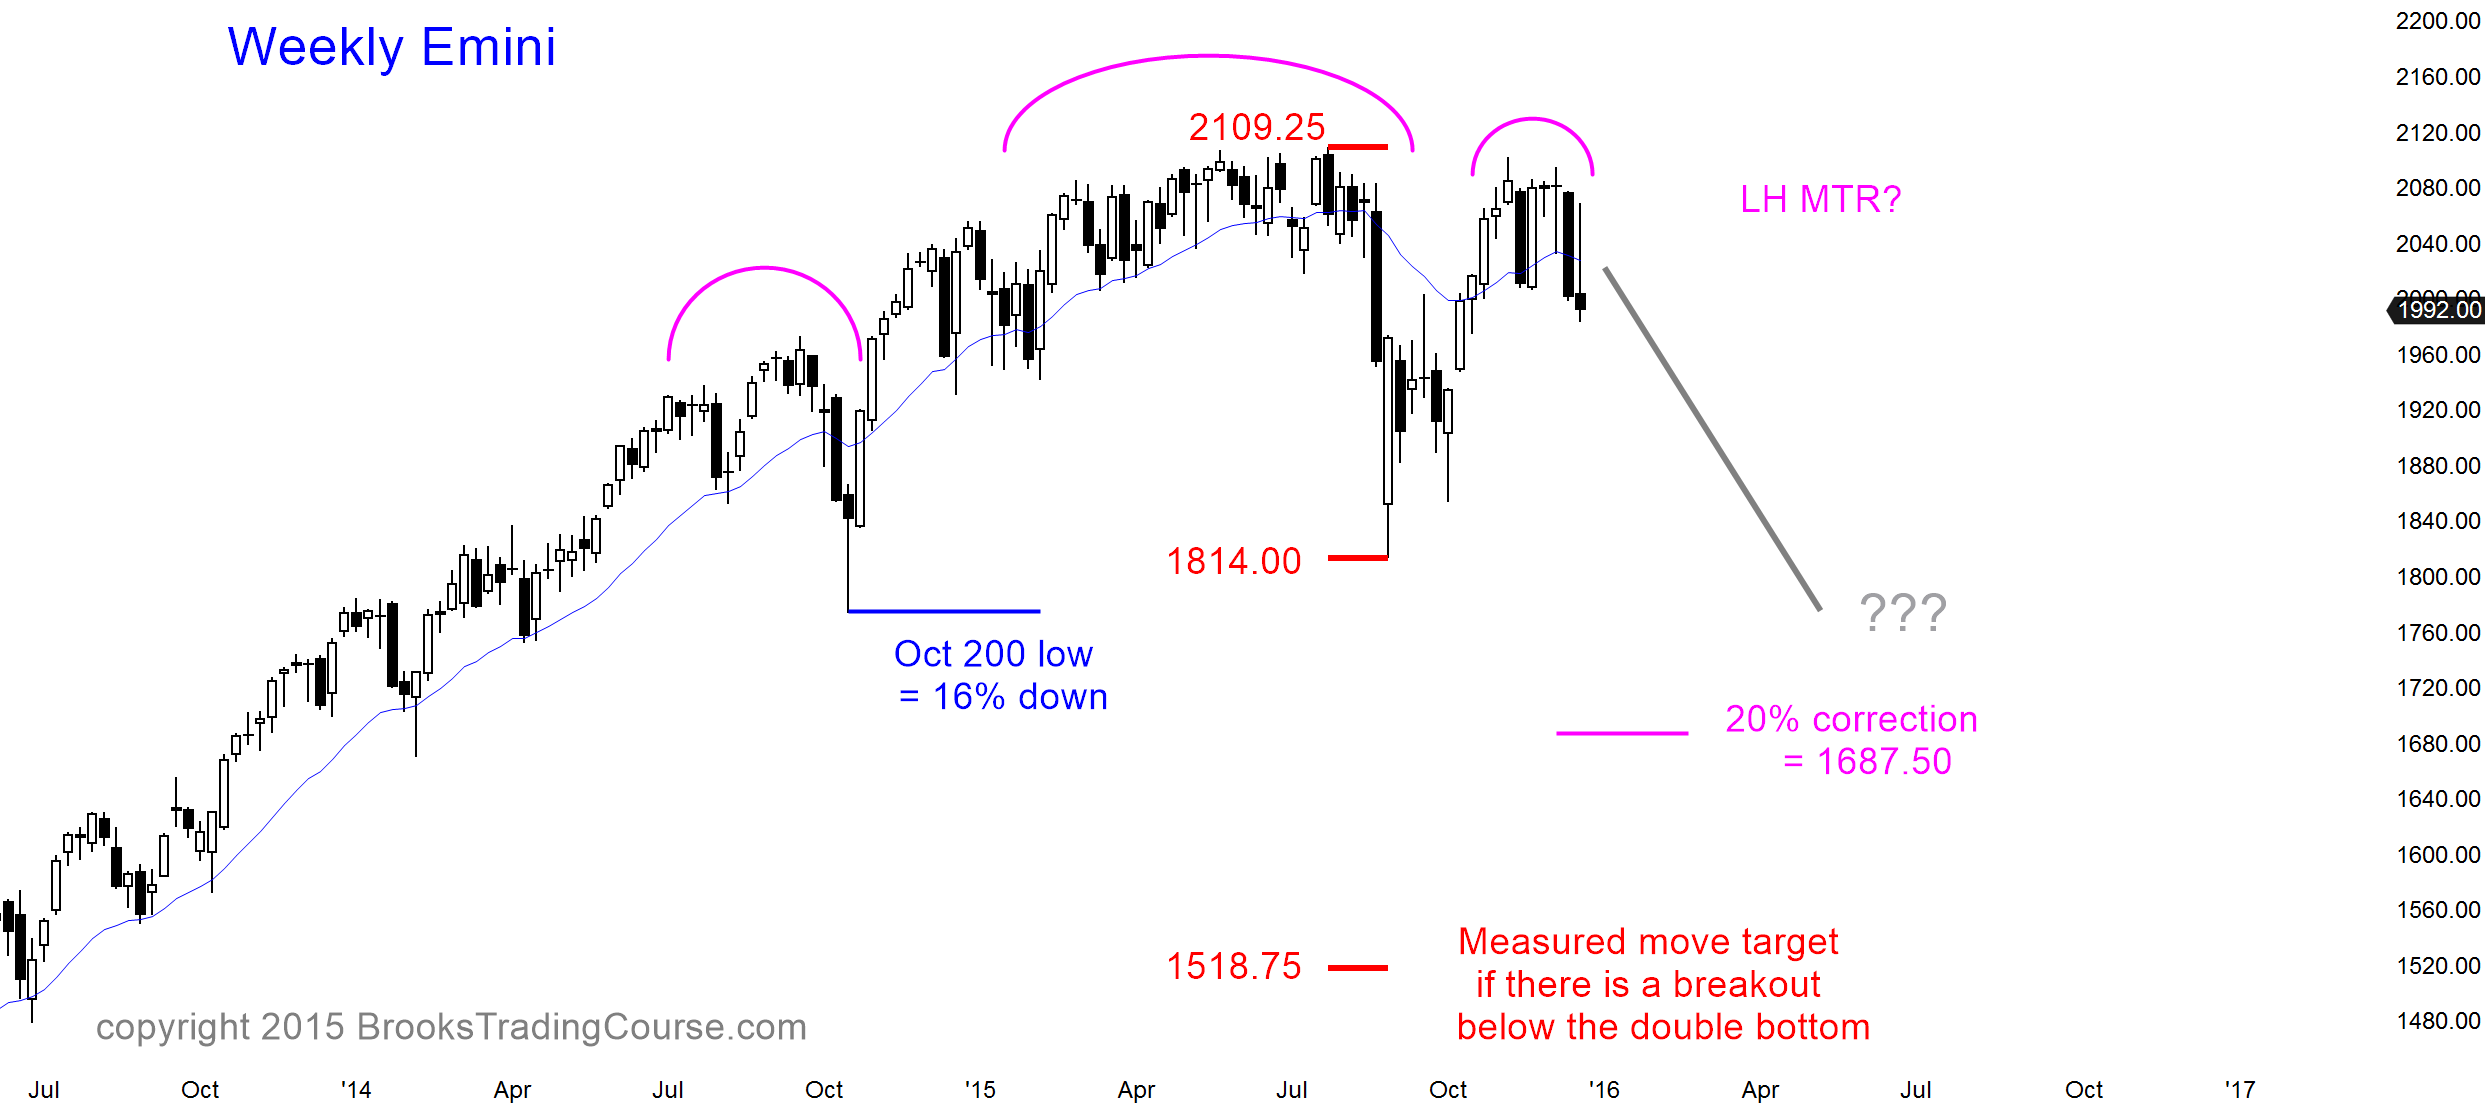
If the S&P Emini falls about 20%, that would be about 400 points from the July 2109.25 high, and it would be around 1700. The monthly bull trend line is also there. The 1st high of the 2000 and 2007 double top is around 1600. If the selloff reaches the bull trend line, then traders will begin to think that it might test one or both of those highs.
I have been writing for a year that there was about an 80% chance of a 10 – 20% correction from this buy climax. The Emini hit 10% in August and October. The bulls have continued to fail to break above the yearlong trading range. There is still a 50% chance of a test of the August low before a new all-time high, and a 30% chance of a test of the monthly bull trend line that is around 1700. There is also also a 50% chance of a new all-time high before the Emini tests the August low.
Weekly S&P500 Emini futures candlestick chart: Follow-through selling, but a doji
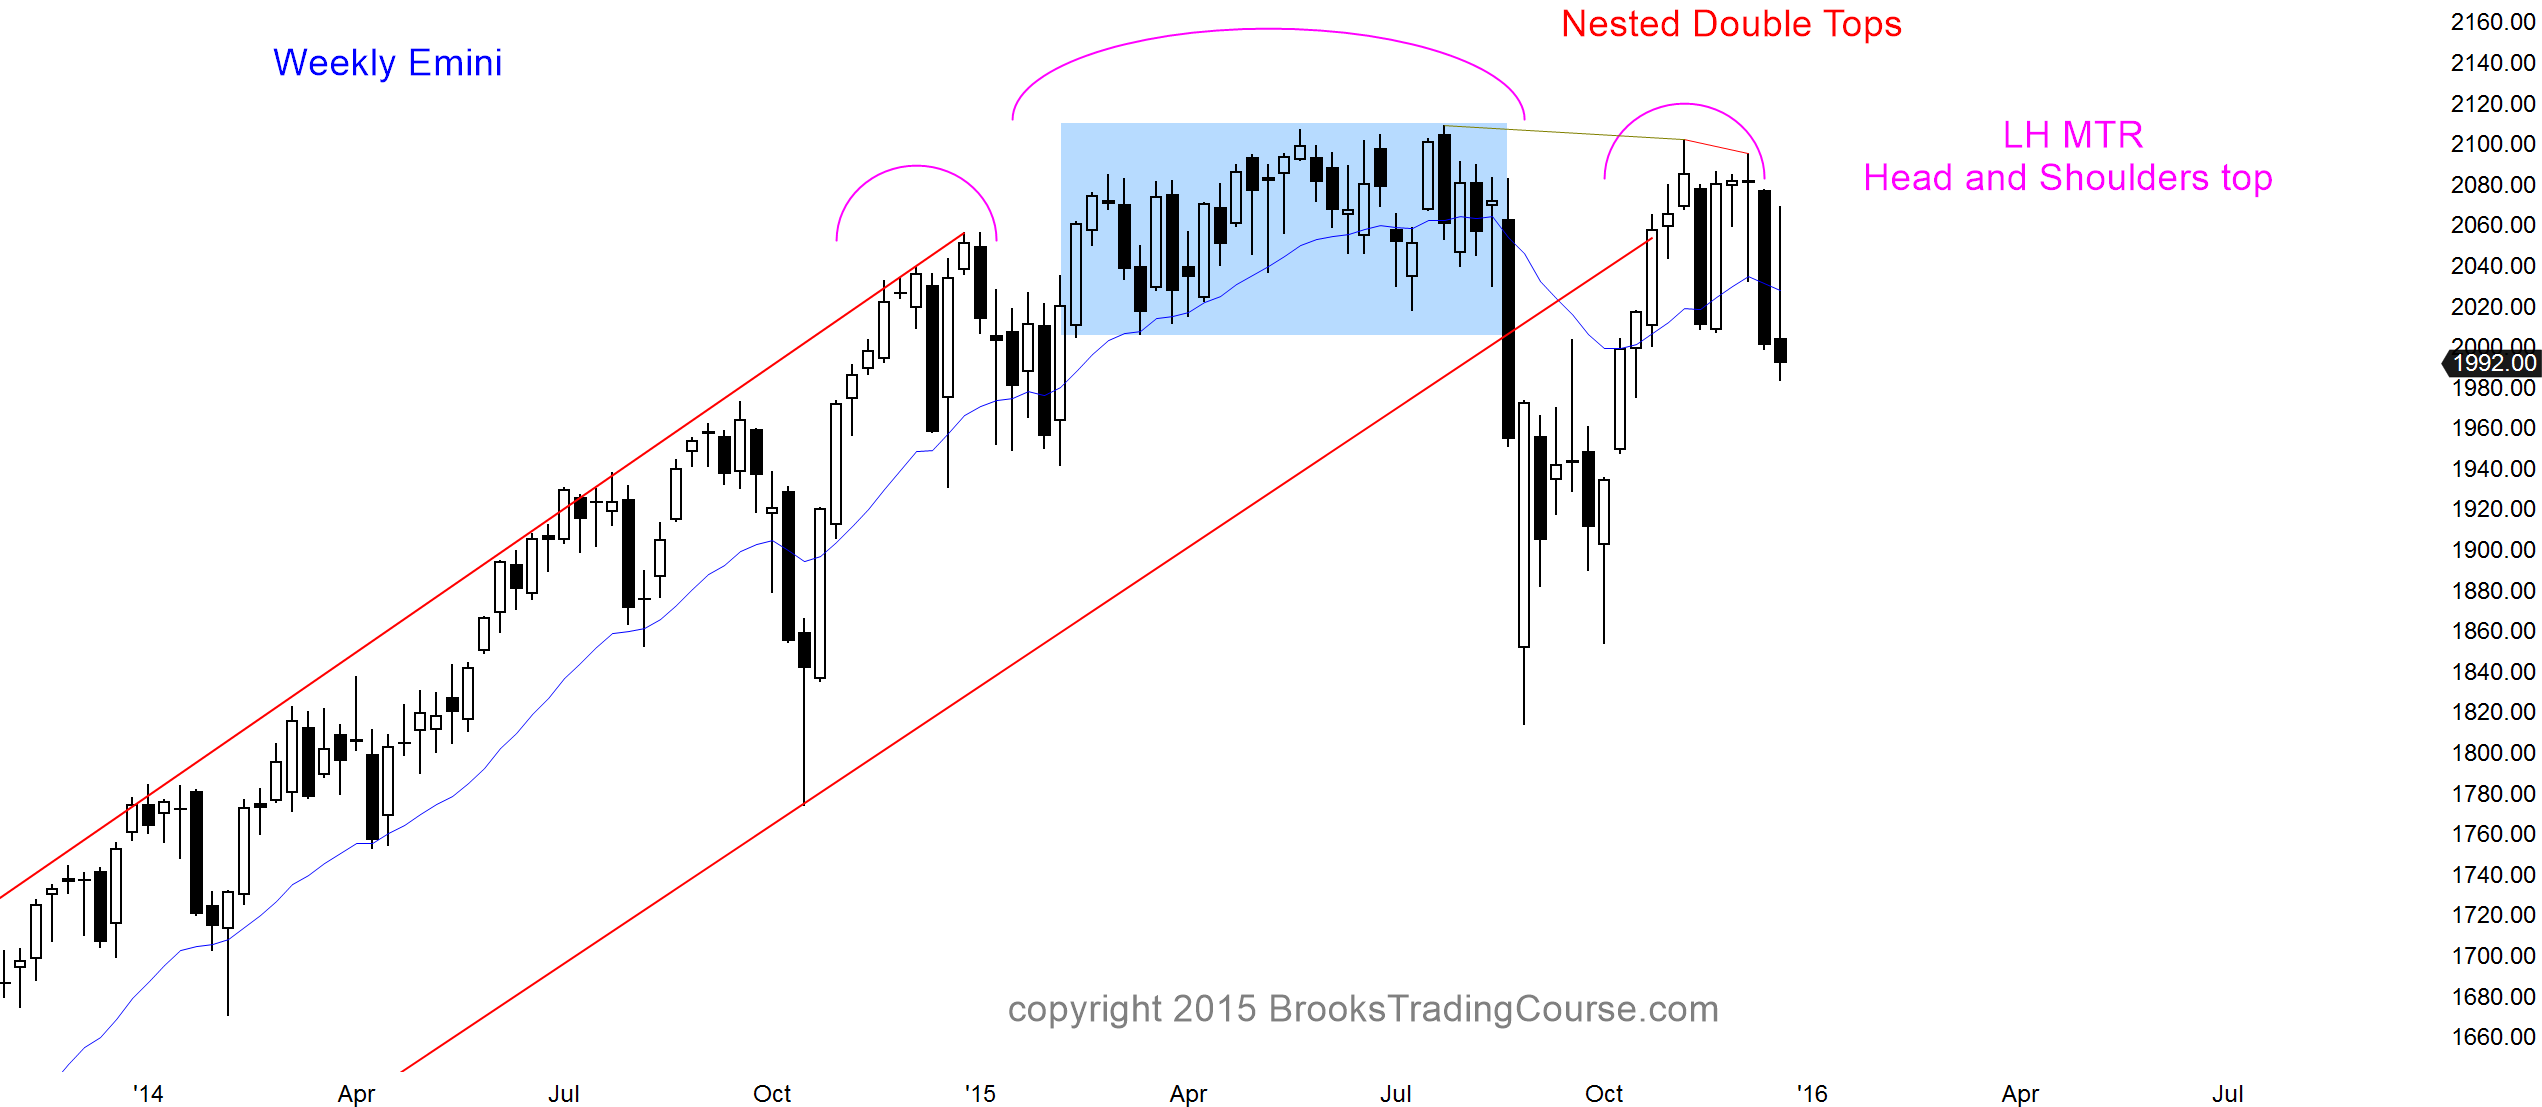
The weekly S&P500 Emini futures candlestick chart formed a bear doji this week. It closed below last week’s low and the low of the past 9 weeks. Because it had a bear body, it confirmed that the bears have taken control.
The context is good for the bears. There is a 5 bar double top and a big double top with the July high. This combination of context and follow-through selling is enough to make the weekly chart Always In Short. This means that there will probably be at least one or two more weeks down.
The bulls still believe that this is a 6 pullback from the October rally on the weekly chart, and it is therefore simply a big bull flag. It is in the middle of the October rally, and bulls look to buy around 50% down from the high. The bulls see this past week’s doji as a weak follow-through bar from the prior week’s big bear bar. They expect a breakout above the 2 month trading range followed by a 100 point measured move up. They also eventually expect a 300 pointmeasured move up from the breakout to a new high. This is because the current high is the neck line of the October 2014 – August 2015 double bottom. However, the bulls are aware that the past 2 weeks might have follow-through selling before they are able to regain control and create a new all-time high. Their stop is still below the bottom of the October low at 1814. They will exit before then if the momentum down accelerates.
Daily S&P500 Emini futures candlestick chart: Learn how to trade an early bear trend
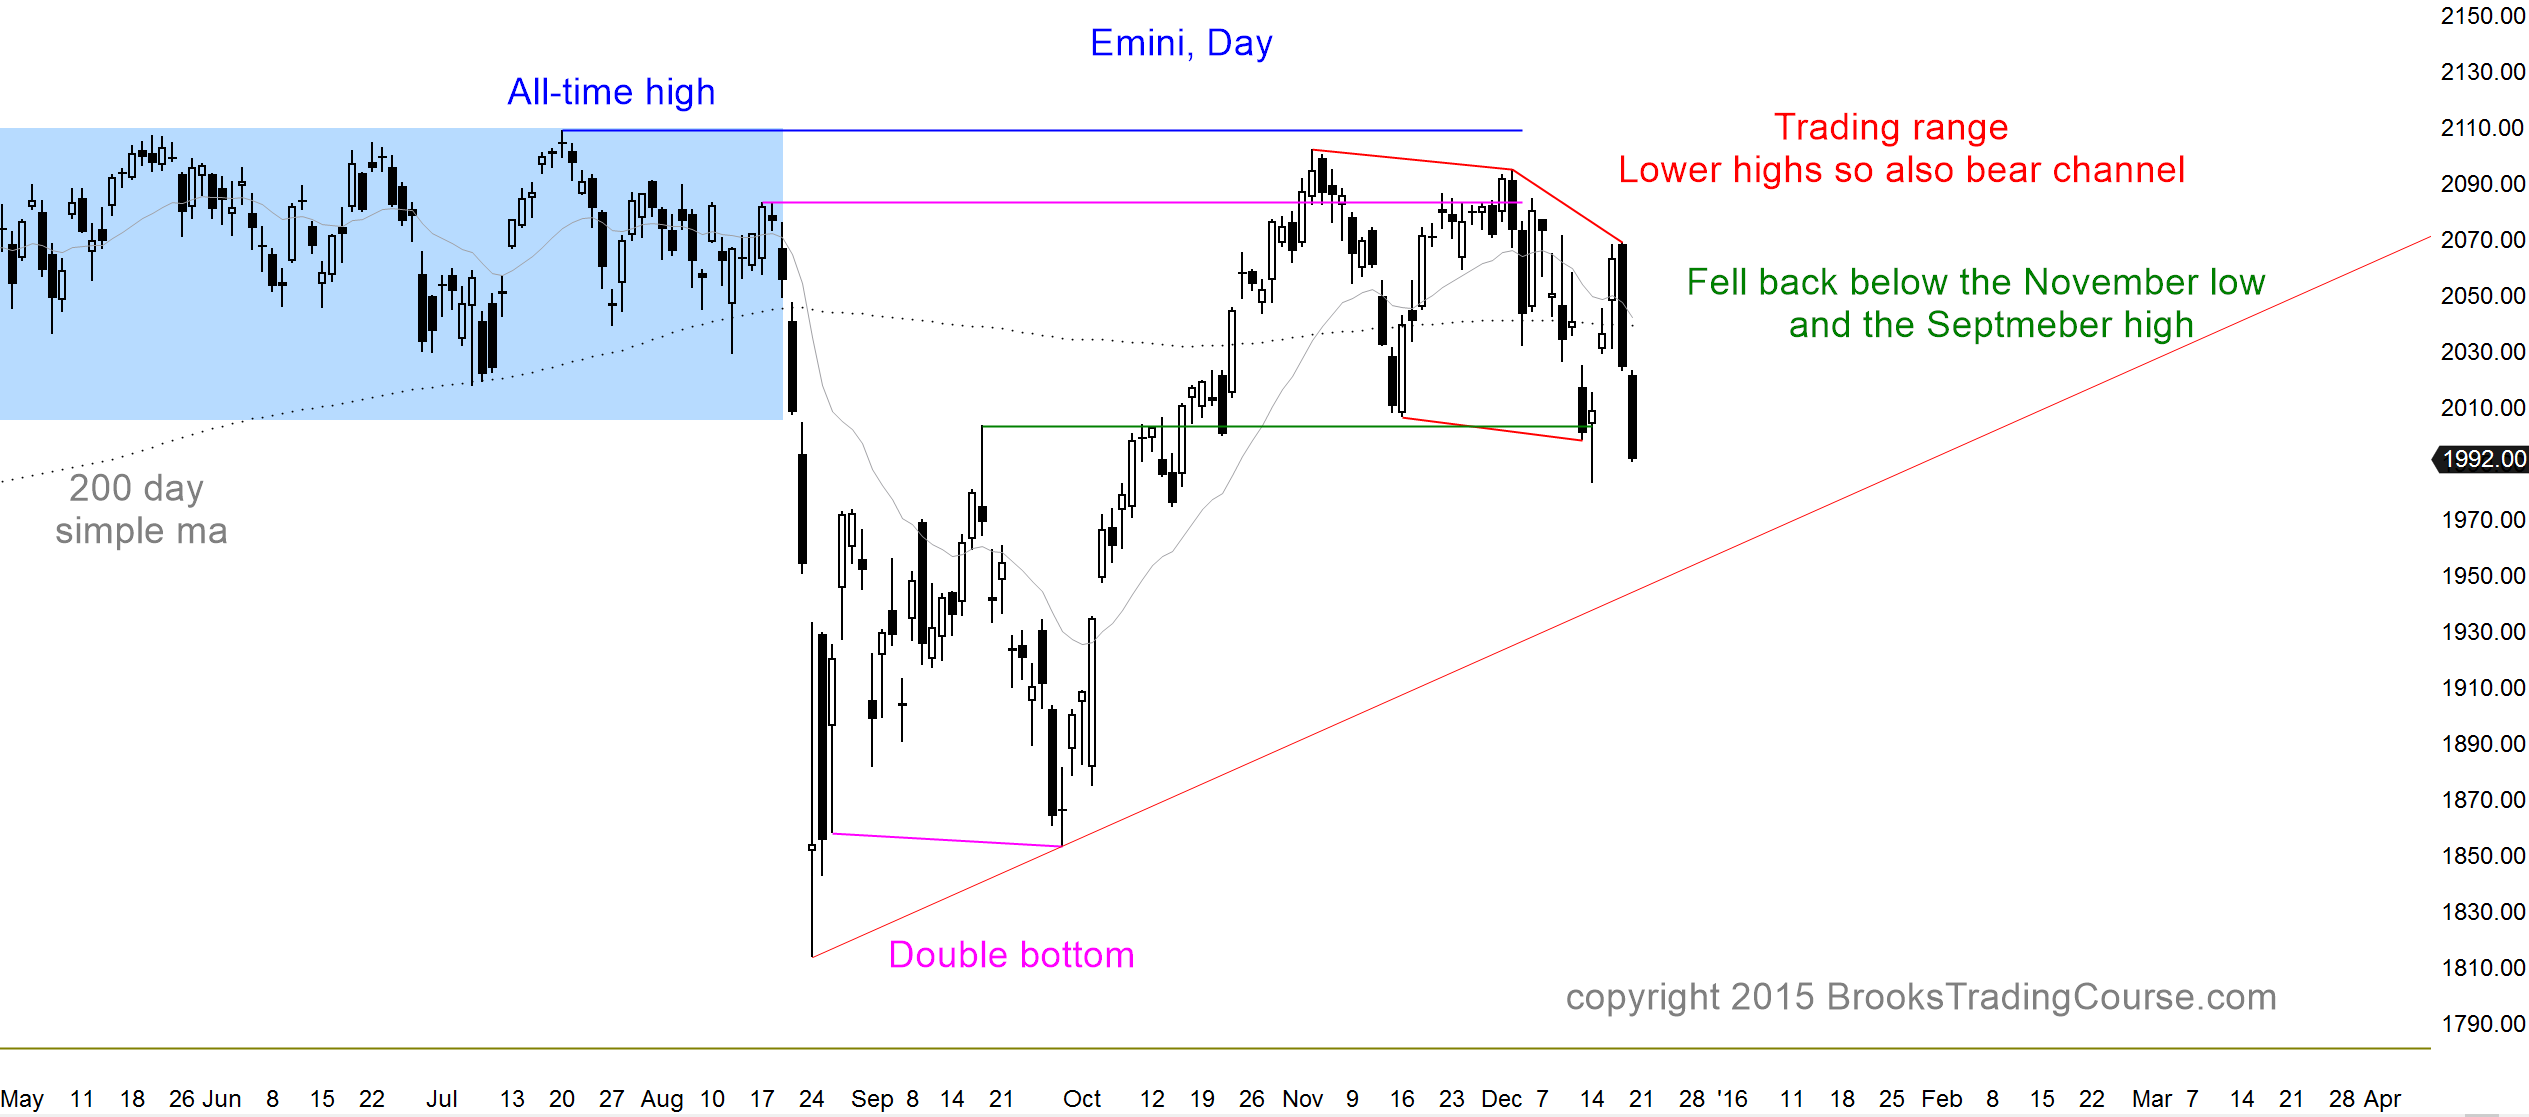
The daily S&P500 Emini futures candlestick chart is in an early bear trend. It formed a 2 day island bottom earlier this week and ended the week with a 3 day island top.
I have repeatedly mentioned my 80% rule. No matter how strong a rally is, like the rallies in October and November, and no matter how strong a selloff is, like the one in November and the current one, 80% of these trading range breakout attempts fail. When a strong leg is forming, it is easy to just look at the past few bars and conclude that there will be strong enough follow-through to create a successful breakout. That is ignoring history. Until there is a breakout, there is no breakout. Obviously one of the strong legs up and down will lead to a successful breakout. It is a mistake to believe that the momentum alone is enough to make the probability of a breakout high when the strong leg is still within the range.
The past 2 days were big bear trend bars closing on their lows. They turned down from another lower high. This is a bear channel, and therefore a bear trend on the daily chart. Every trading range is always both in a bull trend and a bear trend. The Emini is therefore also in a bull trend. The Emini is above the bottom of the October rally, and the bulls can argue that the Emini is still forming higher low and a wedge bull flag.
Look back over the past 2 months. There were 2 other strong selloffs lasting 2 – 3 days that were just as strong as the one at the end of this week. Both reversed up sharply. The bears have slightly better probability this time. The bulls should not have allowed the December 14 low to fall below the November low, which was the neck line of the double top. If they were truly strong, they also should not have allowed it to fall below the September high, which was the neck line of the double bottom. The Emini on Friday fell below those key support levels for a 2nd time. Traders see this as a confirmation that support is failing. This increases the chances of follow-through selling.
The Emini is in a bear trend on the daily chart. The bears need to demonstrate strength before traders will conclude that there will be a measured move down from this 2 month trading range. They need a strong breakout below the December 14 low. The next support is the October 5 gap, just below 1950. That is also around a bull trend line. There is a 60% chance of reaching those level within the next week or two. If there is a bear breakout and it is not strong, traders will see the entire 2 month selloff as a wedge bull flag (3 pushes down), and they will look to buy a reversal up. If instead the bears get a strong breakout, traders will then look for lower support before considering buying again. The next support is the October bottom of the big bull bar that began the October rally. It is at 1875.25. Next support is at the August and October lows.
The week before and the week after Christmas often have many small trading range days. This is true even when there is a strong move leading up to the holidays. While the momentum down is strong on the daily chart, it could be an exhaustive sell climax that is simply a test of the bottom of the 2 month trading range. If there is quiet holiday trading instead of strong follow-through selling, traders will see it as a disappointment for the bears. It would raise the probability of a new high before a test of the August low back up to 50%.
See the weekly update for a discussion of the price action on the weekly candlestick chart and for what to expect going into next week.


 Review")


