Monthly S&P500 Emini futures candlestick chart: Learn how to trade a buy flag in a buy climax
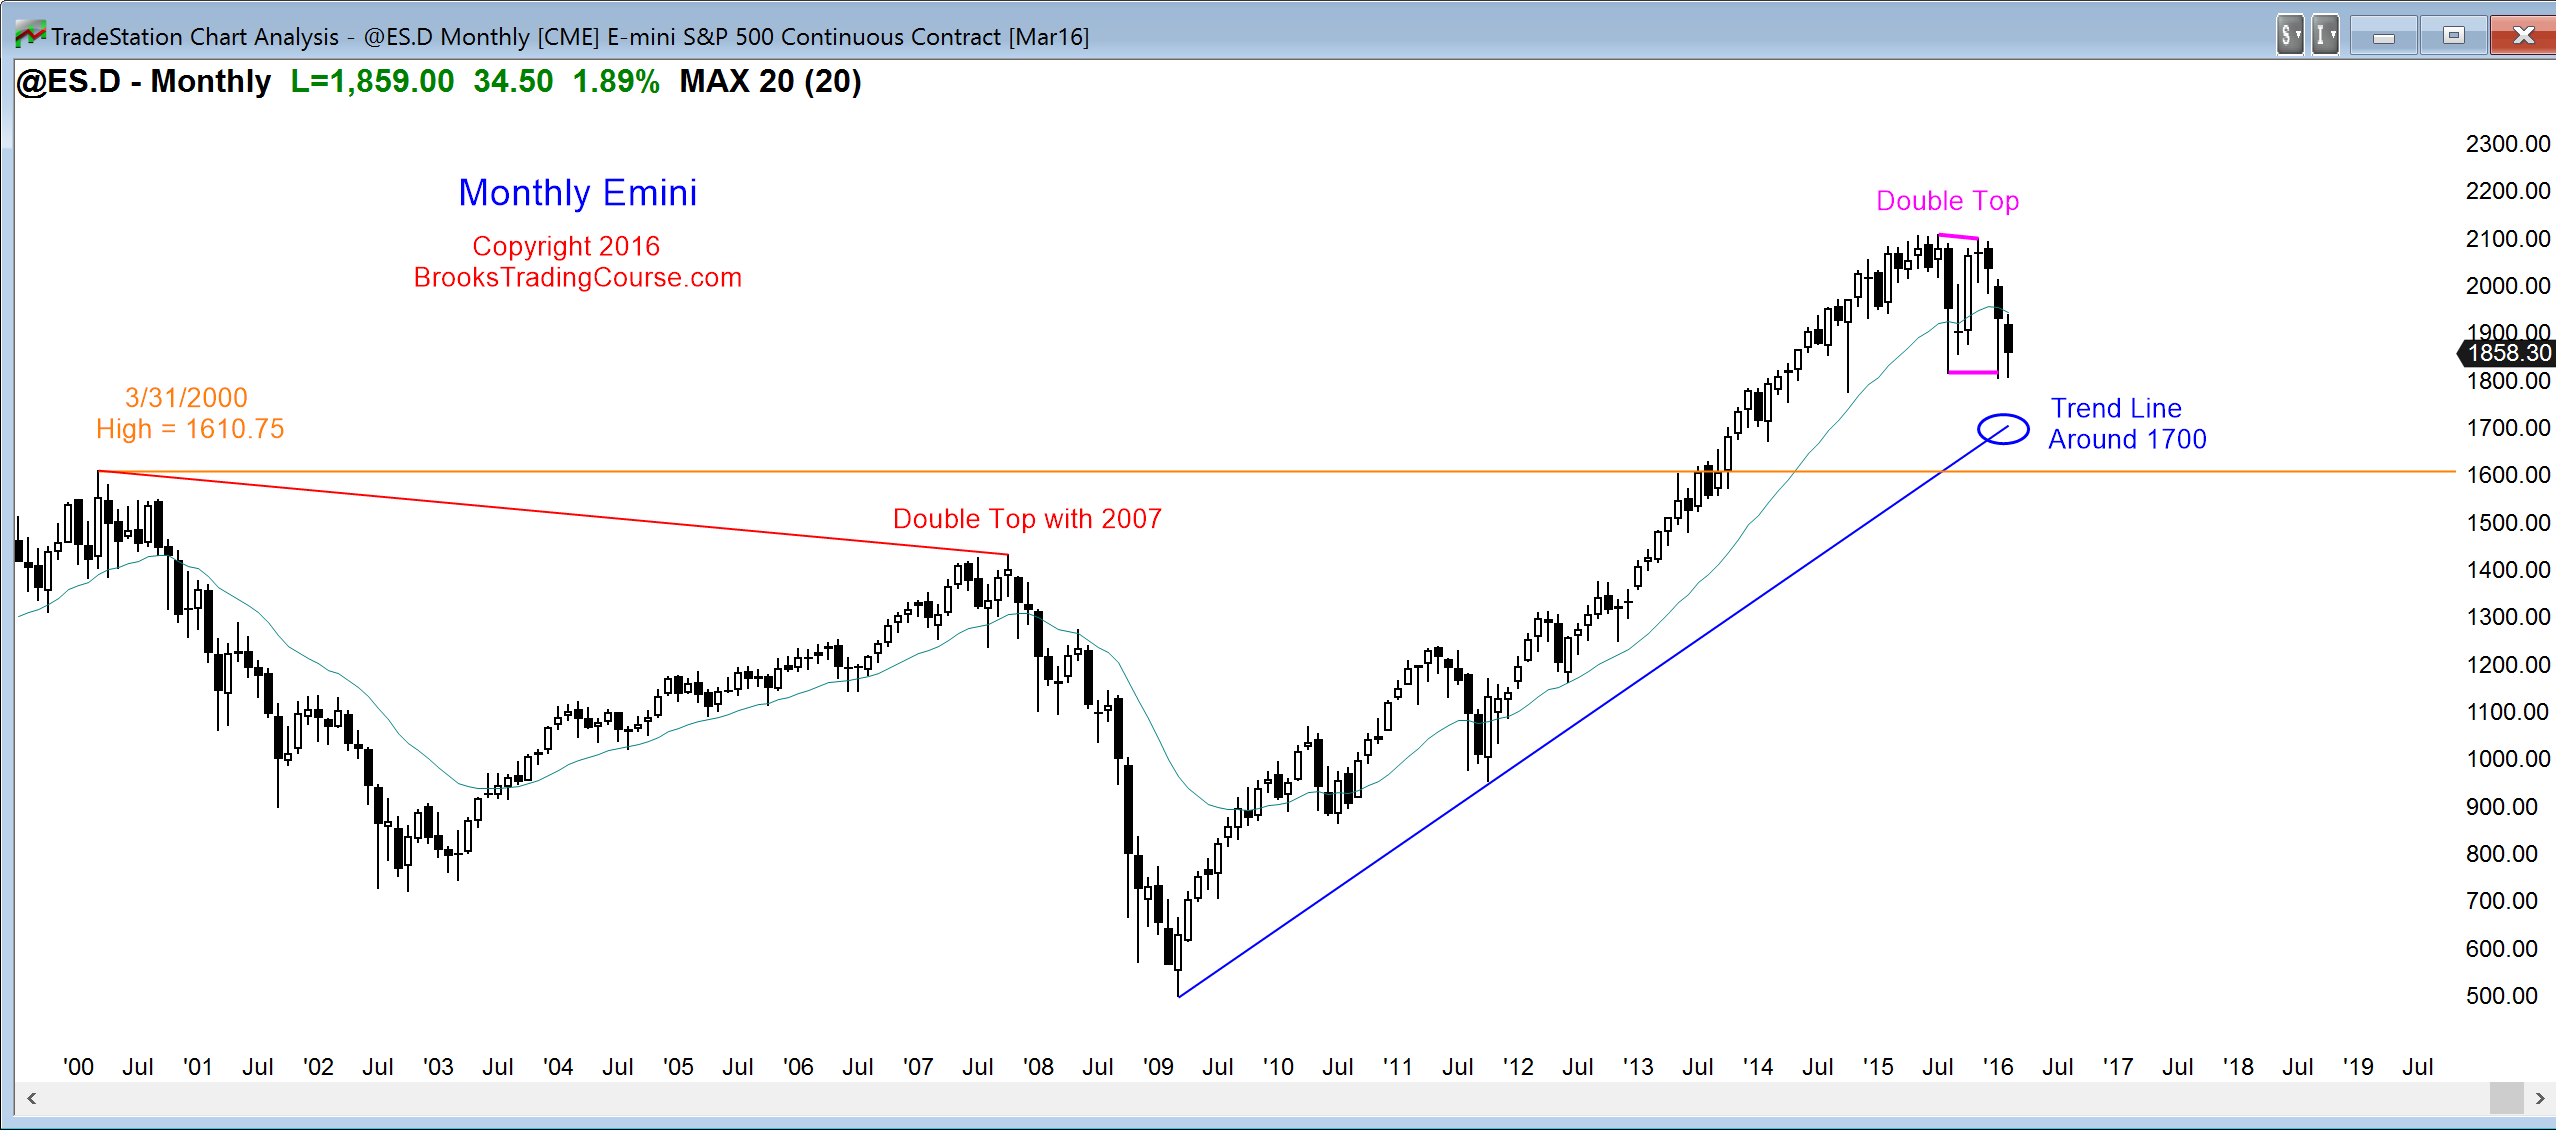
The monthly S&P500 Emini futures candlestick chart is still in a bull flag at the moving average. Because is it forming late in a bull trend, the odds favor either a bear breakout or a failed bull breakout (Final Flag top). If the bulls get a breakout to a new high, it will probably fail within 5 bars (months).
Whether or not there is a bull breakout, the odds are that the 7 year buy climax will be followed by at least a TBTL Ten Bar Two Legged correction on the monthly chart. There is plenty of time left in the month, and the candlestick pattern might end up as either a bull reversal bar or a big bear breakout bar. Since the candlestick pattern is a trading range, the most likely outcome will be disappointed bulls and bears, which means a close somewhere in the middle of the month. There is still a 60% chance of a bear breakout before a new all-time high, and a 50% chance of a test of the bull trend line at around 1700. There is also a 30% chance of a breakout test of the double top, which means a drop down to 1600 or below.
Weekly S&P500 Emini futures candlestick chart: Struggling to hold above the trading range low
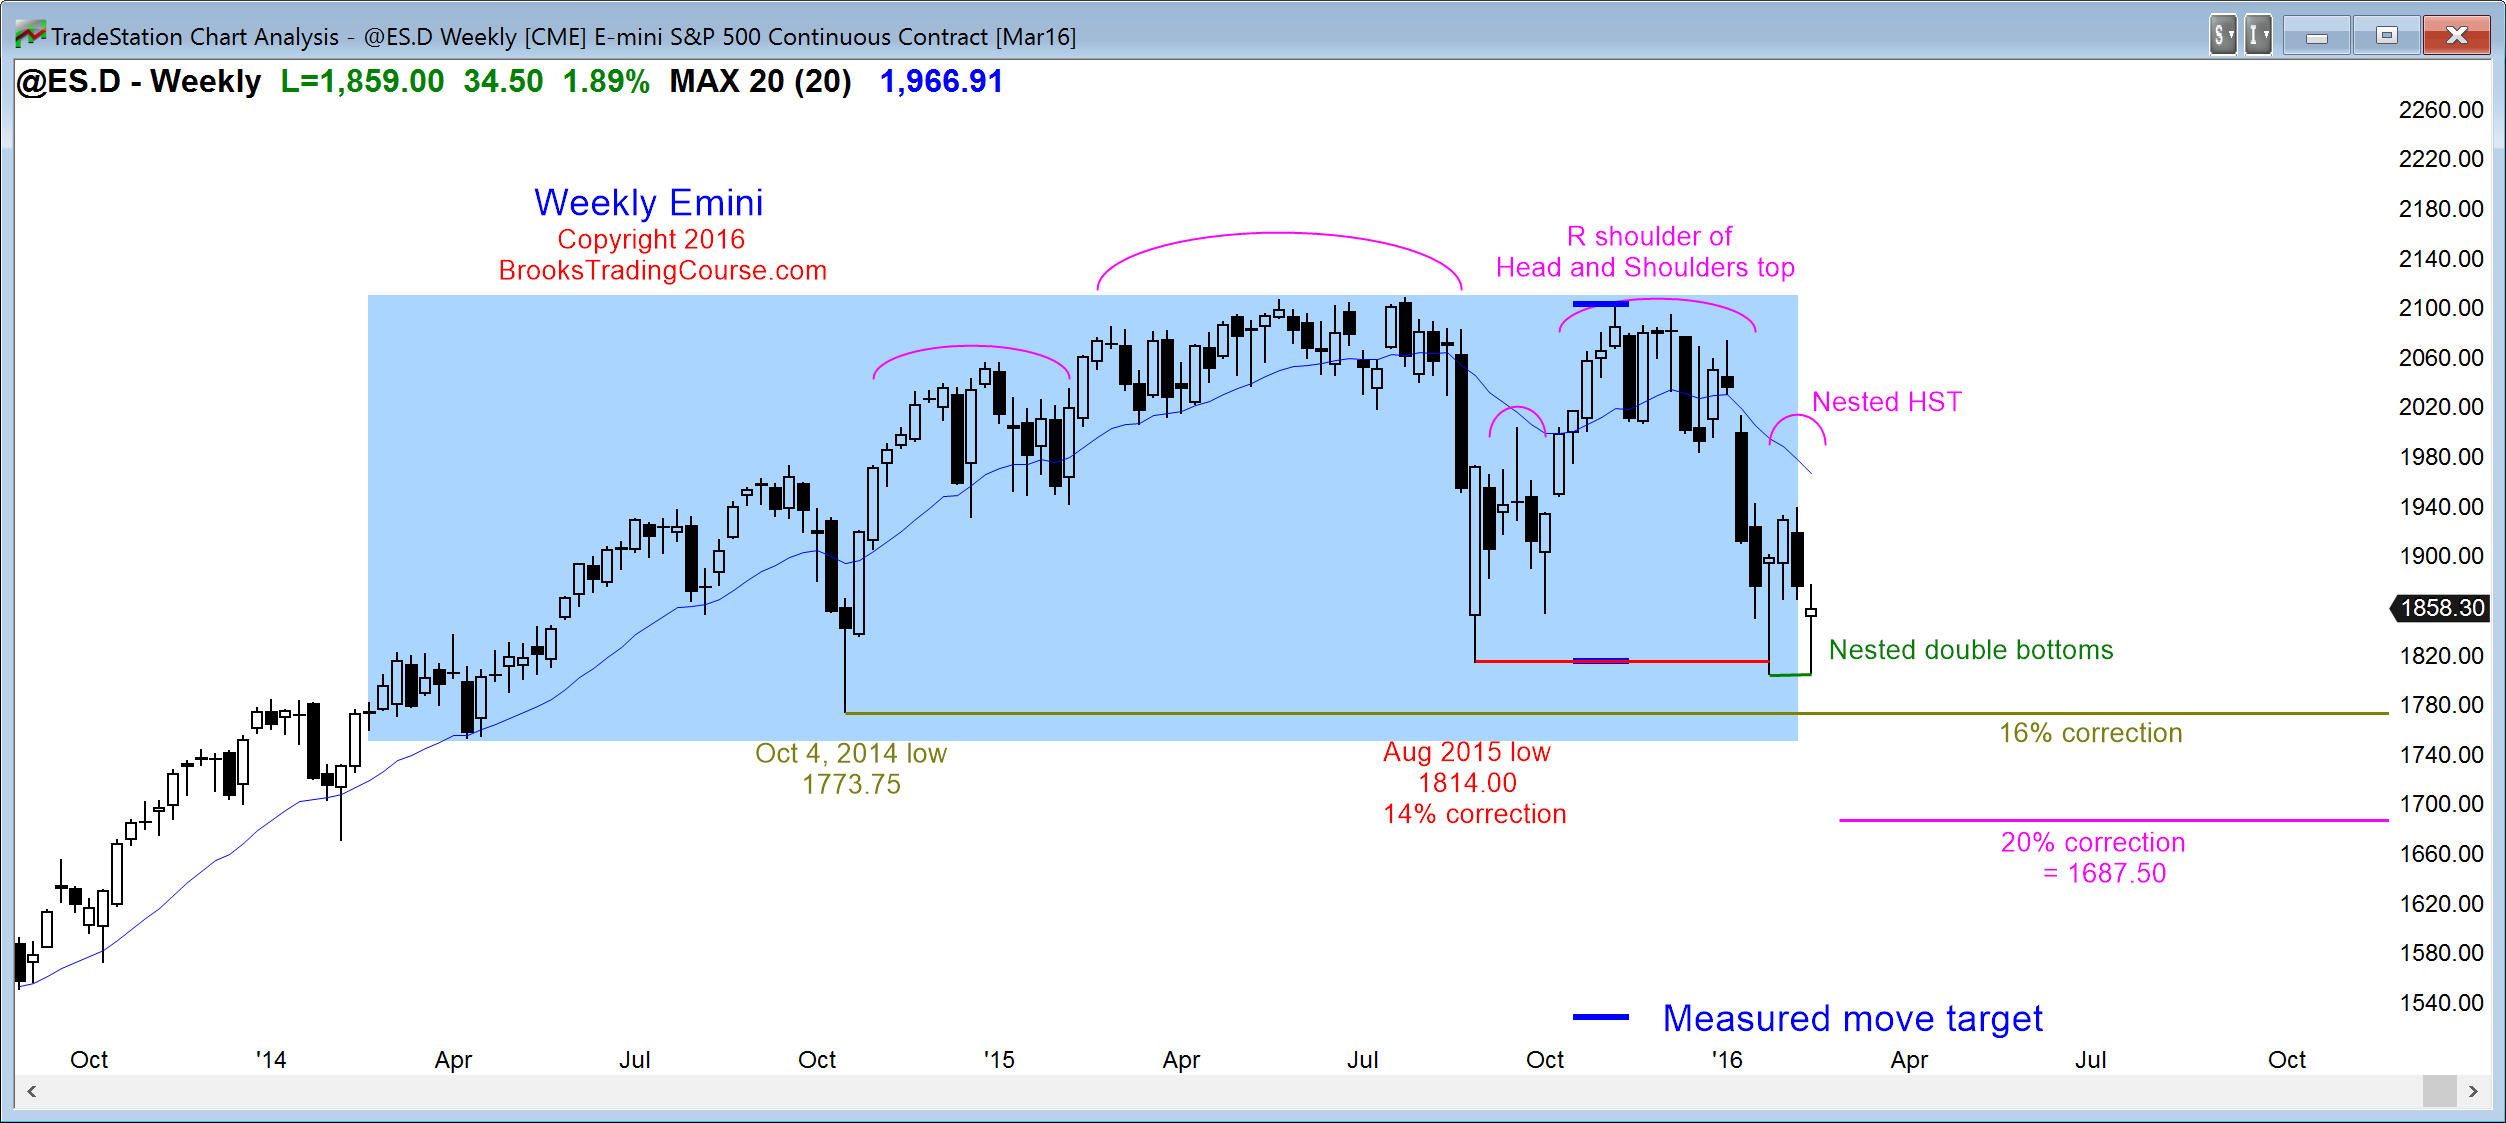
The weekly S&P500 Emini futures candlestick chart is still in its 2 year trading range. It reversed up this week and closed above the open of the week, but the reversal bar was another doji, like 3 weeks ago. It is a buy signal bar, but not a strong one. The bulls need a strong bull breakout over the next several weeks if they hope to repeat the bull reversals of October 2014, August 2015, and October 2015. With this weak buy setup, the odds are that they will fail, and that whatever rally comes over the next few weeks will fail to get above the October lower high.
If there is a rally next week, and the odds are that there will be one, there is only about a 50% chance that it will get above the February high. If it does, there is a 50% chance that the bull breakout will fail in a couple of weeks. The bears would see the candlestick pattern as a Low 2 (ABC) bear flag below the moving average. If the bulls get the breakout above the February high, they would then have about a 50% chance of getting above the October lower high. The bulls need to create a series of strong bull trend bars. This means big bull trend bars closing on their highs, like they did in October 2014 and October 2015. Without that, traders will see any rally as a bull leg in a bear flag, and they will correctly expect a bear breakout below the January low.
Daily S&P500 Emini futures candlestick chart: Day traders expect follow-through bullish price action
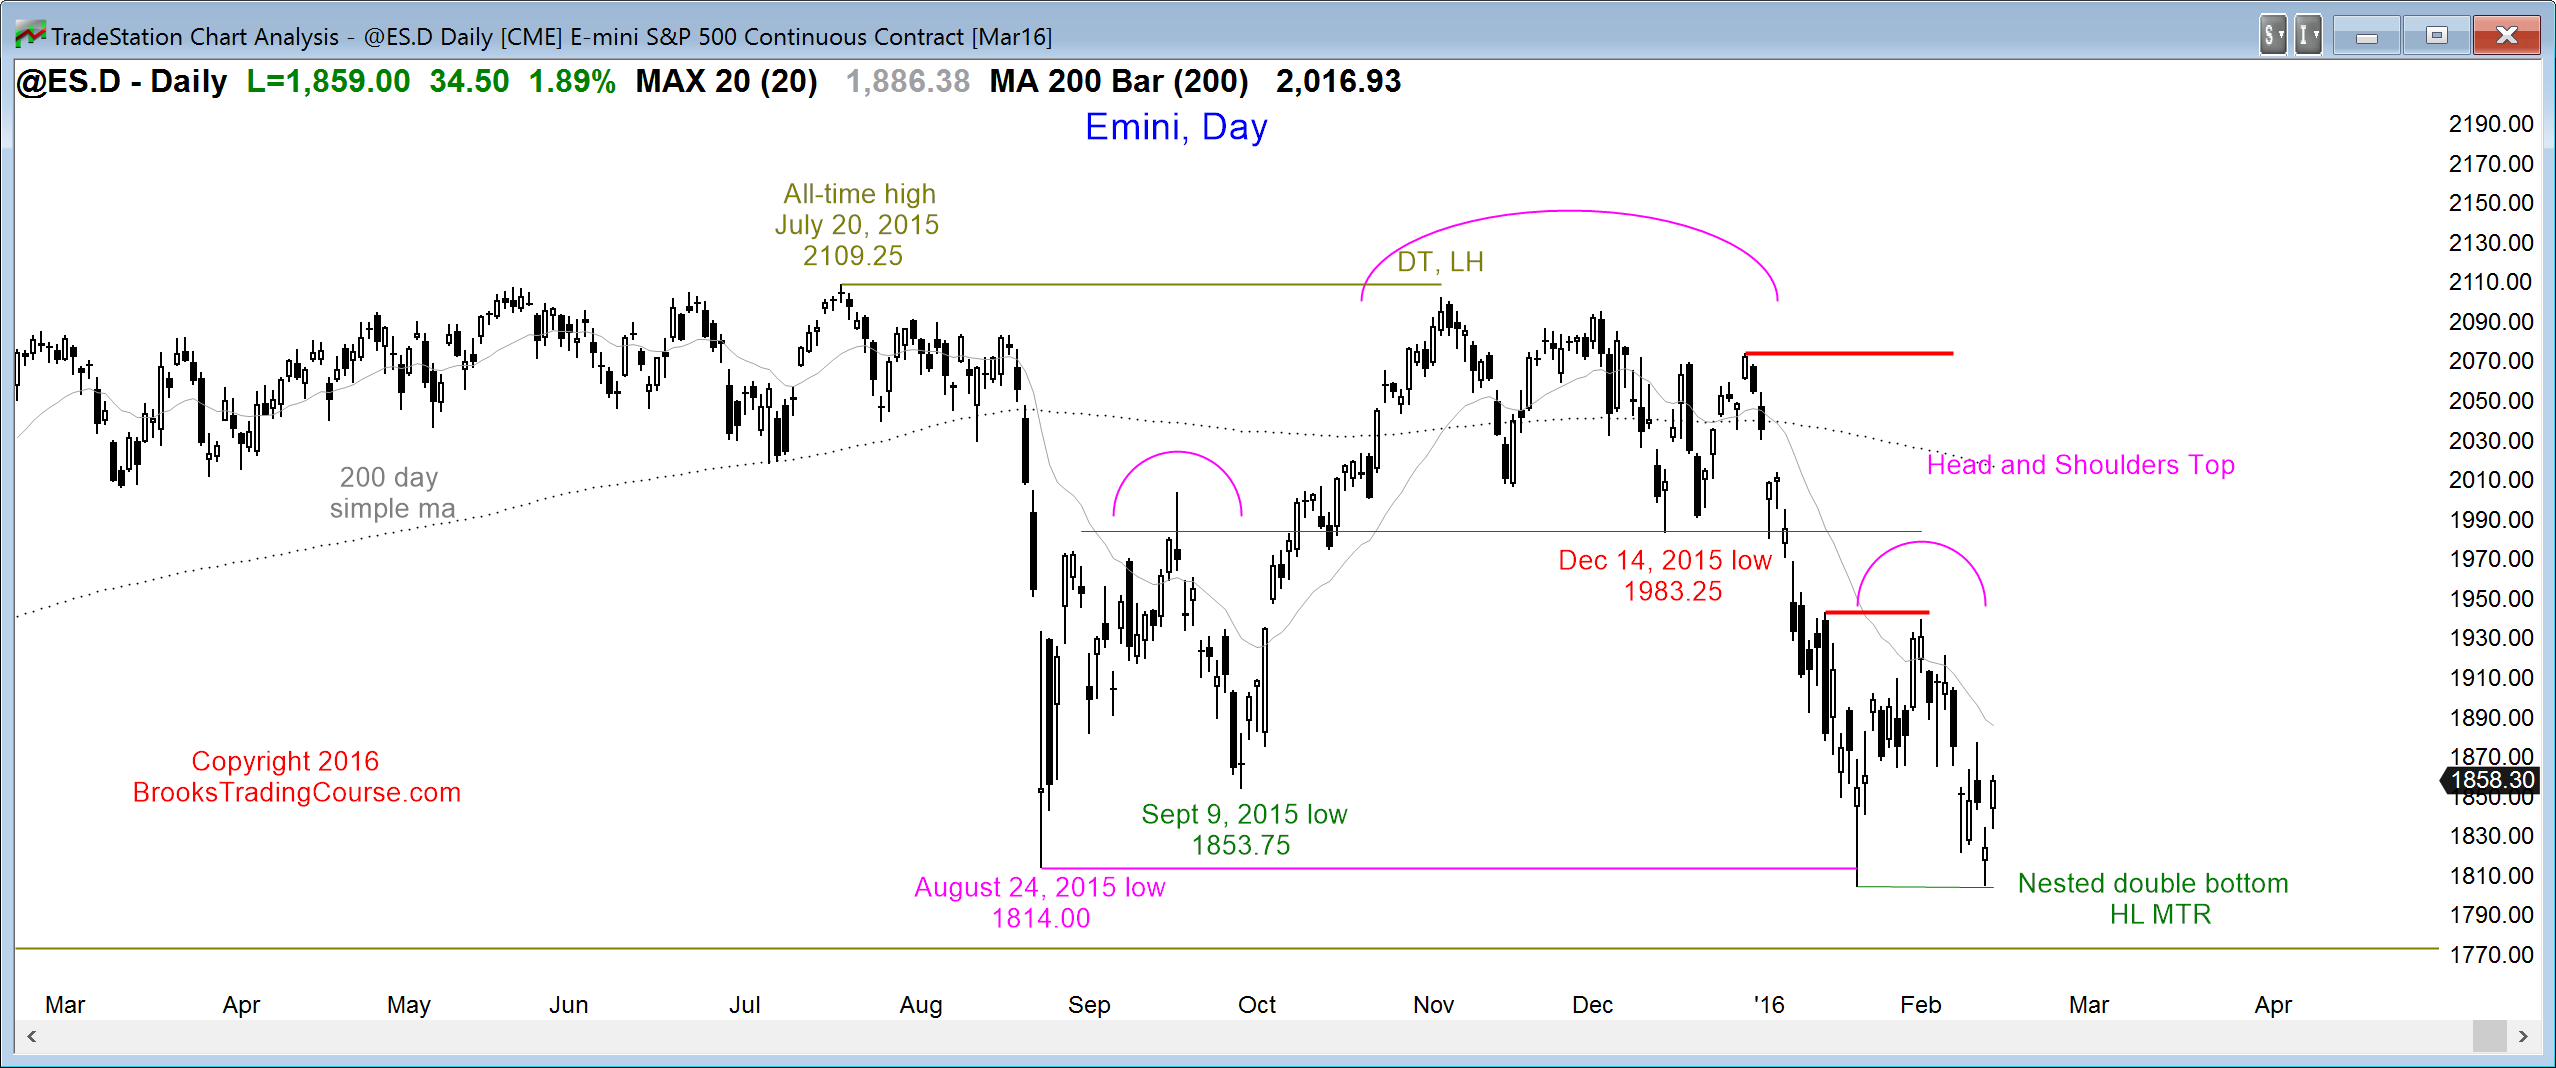
The daily S&P500 Emini futures candlestick chart formed a double bottom with the January low, and this small double bottom is the 2nd leg down in a larger double bottom with the August 2015 low. Thursday’s buy signal bar had a big tail and the bar was small. That is a weak buy candlestick pattern. Friday closed on its high, but the bar was not very big. It is an adequate entry bar, but the bulls need follow-through buying next week to convince traders that they have taken control. Without it, the rally will just be a bull leg in the trading range that began in January.
The micro double bottom this week nested within the double bottom with the January low is good for the bulls. The reversal up is modest, but if there is sustained buying next week in the form of a series of 3 – 4 consecutive bull trend bars closing near their highs, bulls will see that as a type of strong bull breakout. The odds would favor some kind of a measured move up. The odds favor at least some follow-through buying next week because the past 2 days had bull bodies and the context for a rally is good (reversal up from the bottom of a 2 year trading range). Those who trade the markets for a living will watch to see how strong the rally is. Those learning how to trade the markets need to develop the ability to determine if a rally is more likely strong enough to be the start of a bull trend, or not strong, and therefore more likely a bull leg in a bear flag. Next week should give traders more information.
See the weekly update for a discussion of the price action on the weekly candlestick chart and for what to expect going into next week.


 Review")


