Today’s analysis is a continuation of the entry from Friday, where we talked about the attempt to break the top of the formation of the triangle. In the graph below I marked (with an arrow) a candle that was formed during the publication of that analysis.
I also paid attention to the importance of waiting for the candle to be closed. If we compare that H4 and today’s chart, the one below tells us a completely different story.
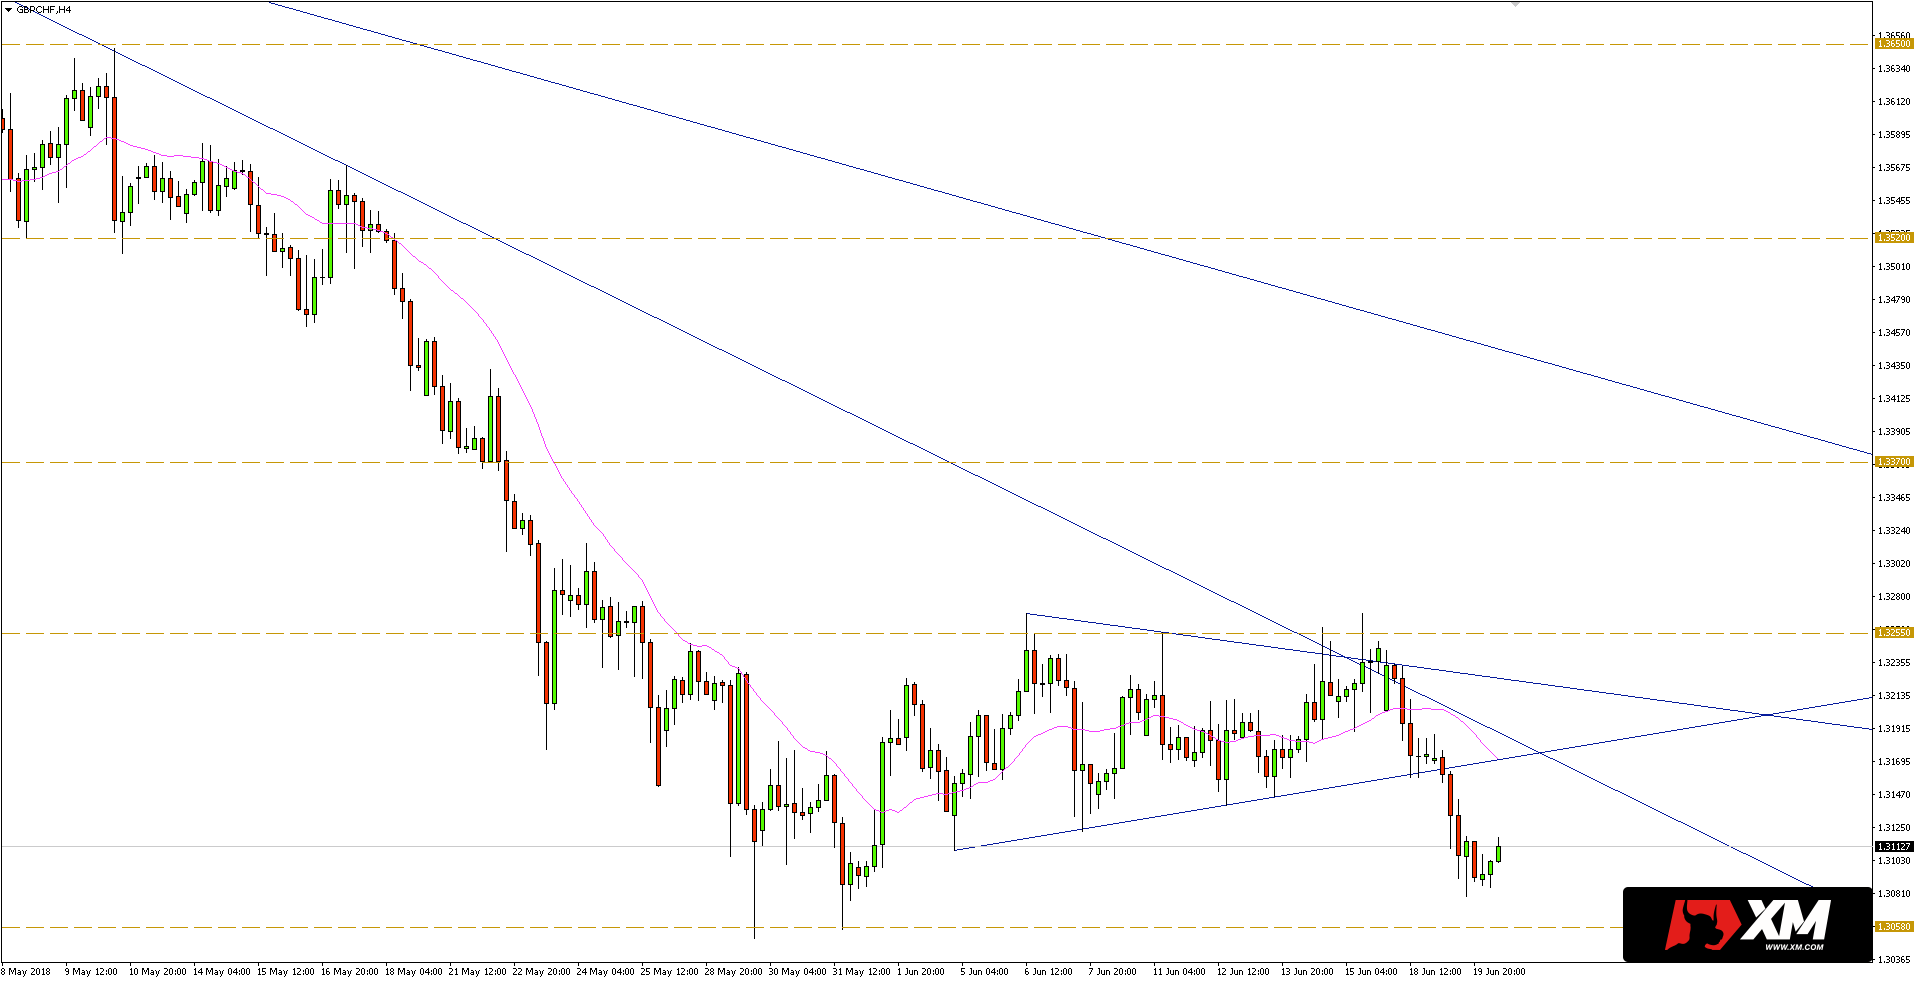
During the candle being formed on Friday, it might seem that the demand side is getting the upper hand. However, after closing on H4 / daily / week interval, it turned out that the upper limit of the triangle was respected, as well as the accelerated trend line from the maximum of April 27.
Declines as a result of the rebound took the course back to support of the triangle, which in turn was overcome during yesterday’s session. Thus, it increased the chance to continue the downward trend. Another important issue concerns the triangle itself. It will always be more beneficial if the breaking occurs in the direction of the trend, as in this particular case.
At present, it seems that the line of the least resistance leads to support in the vicinity of 1.3050. If the bears break this area, the price may fall to 1.2900/30.


 Review")


