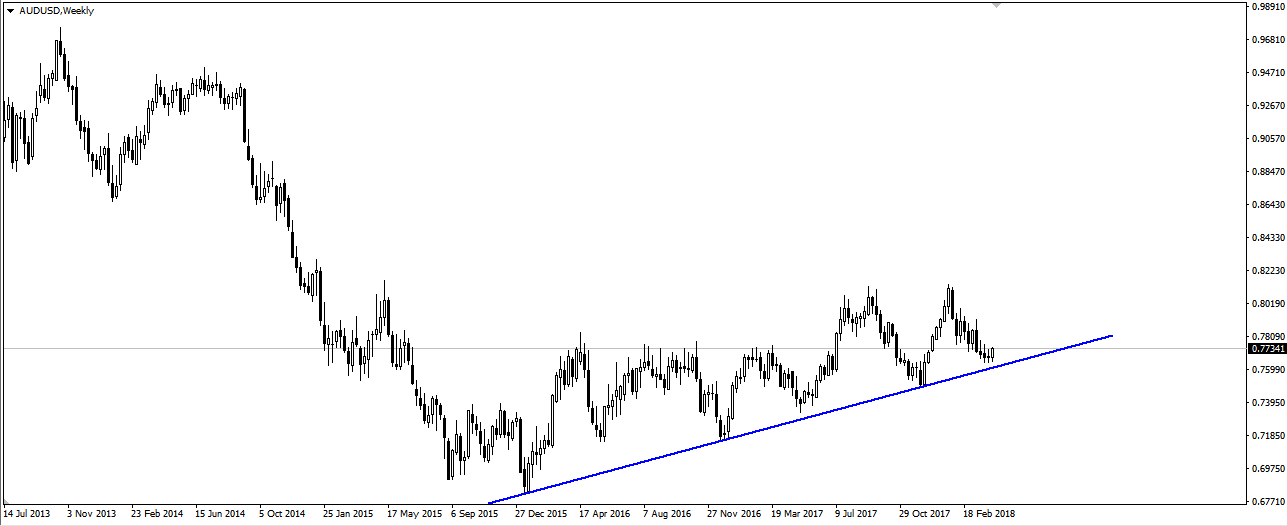
We have an interesting layout on AUD/USD pair, especially if you look on high time intervals. The daily chart shows a downward trend that is close to setting new minimum. Quotations on W1 indicate that the rate is approaching a line connecting number of previous lows over two years. Taking into account the sequence of alternating and comparable price movements in previous years, we could expect a stronger upward rebound in the near future.
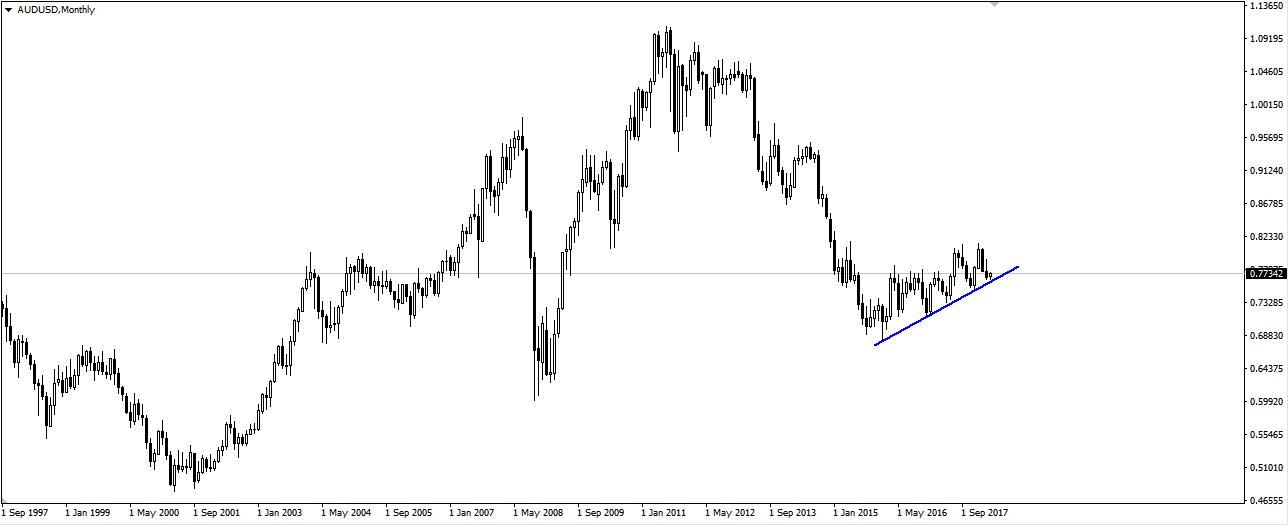
 However, we can look at the same piece of the chart from the even higher monthly time frame. Here the period of the last two years looks haggard, like a typical larger correction in a wider, strong downward trend. So two scenarios are involved. First, the continuation of the trend from 2 years, that is, we are waiting for a rebound. Secondly, breaking this sequence, leaving the correctional wedge formation at the bottom and continuing a wider downward trend.