“Search, Analyse, Trade” is a series of Price Action and Elliott Waves analyses. Its detailed step-by-step description can be found over here. I invite you to today’s review of selected currency pairs and potential trading opportunities. The analyses are based on the Dukascopy sentiment that you can get here.
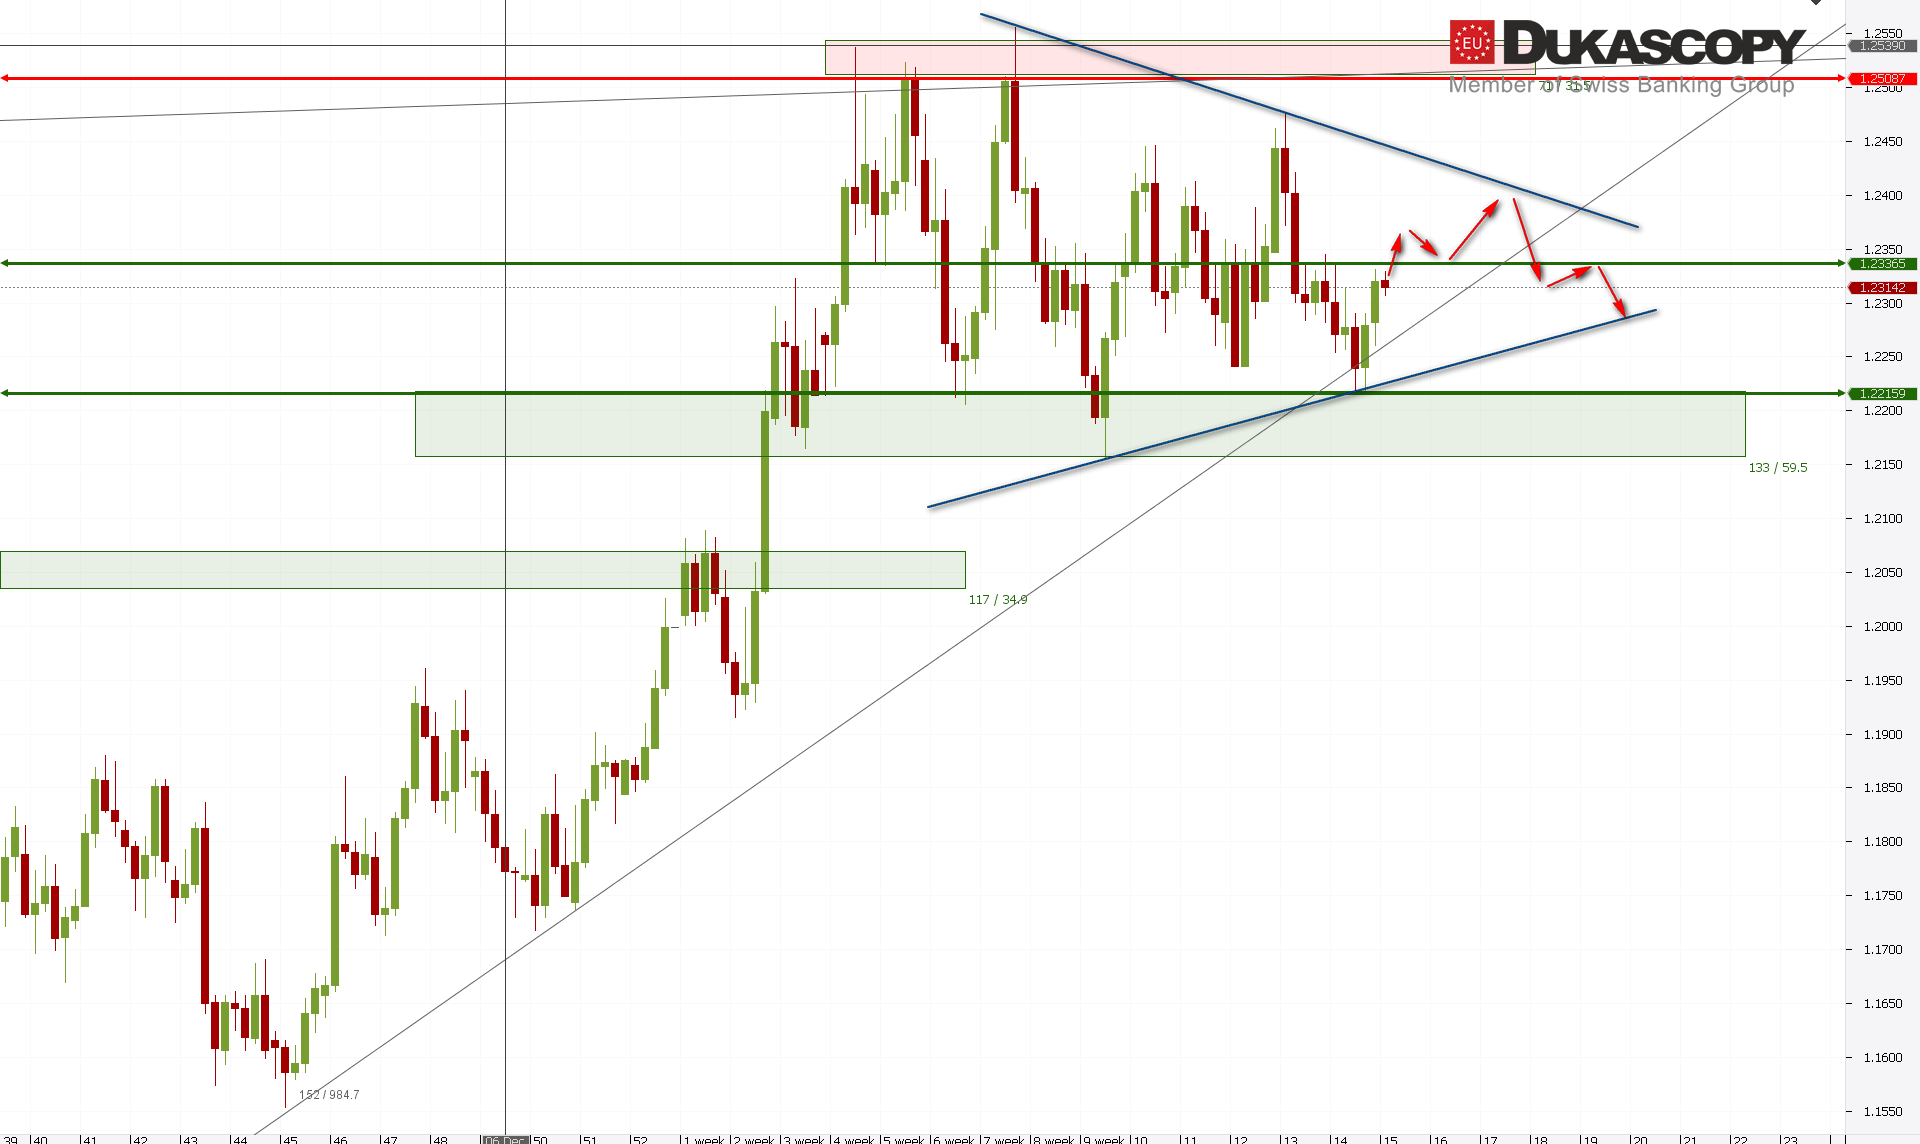 EUR/USD has currently defended the trend line and the upper limit of the support zone and has reached the horizontal S/R line. Each of the forming waves we see from the moment of rejection of the key resistance zone is a three and the structure of the correction triangle is slowly formed. With such an assumption, the mentioned S/R line should be overcome and in the near future we will see a movement towards the upper limitations of the d-wave formation. Rejection of the currently tested resistance and defeating the line extended on the lows negates such a scenario.
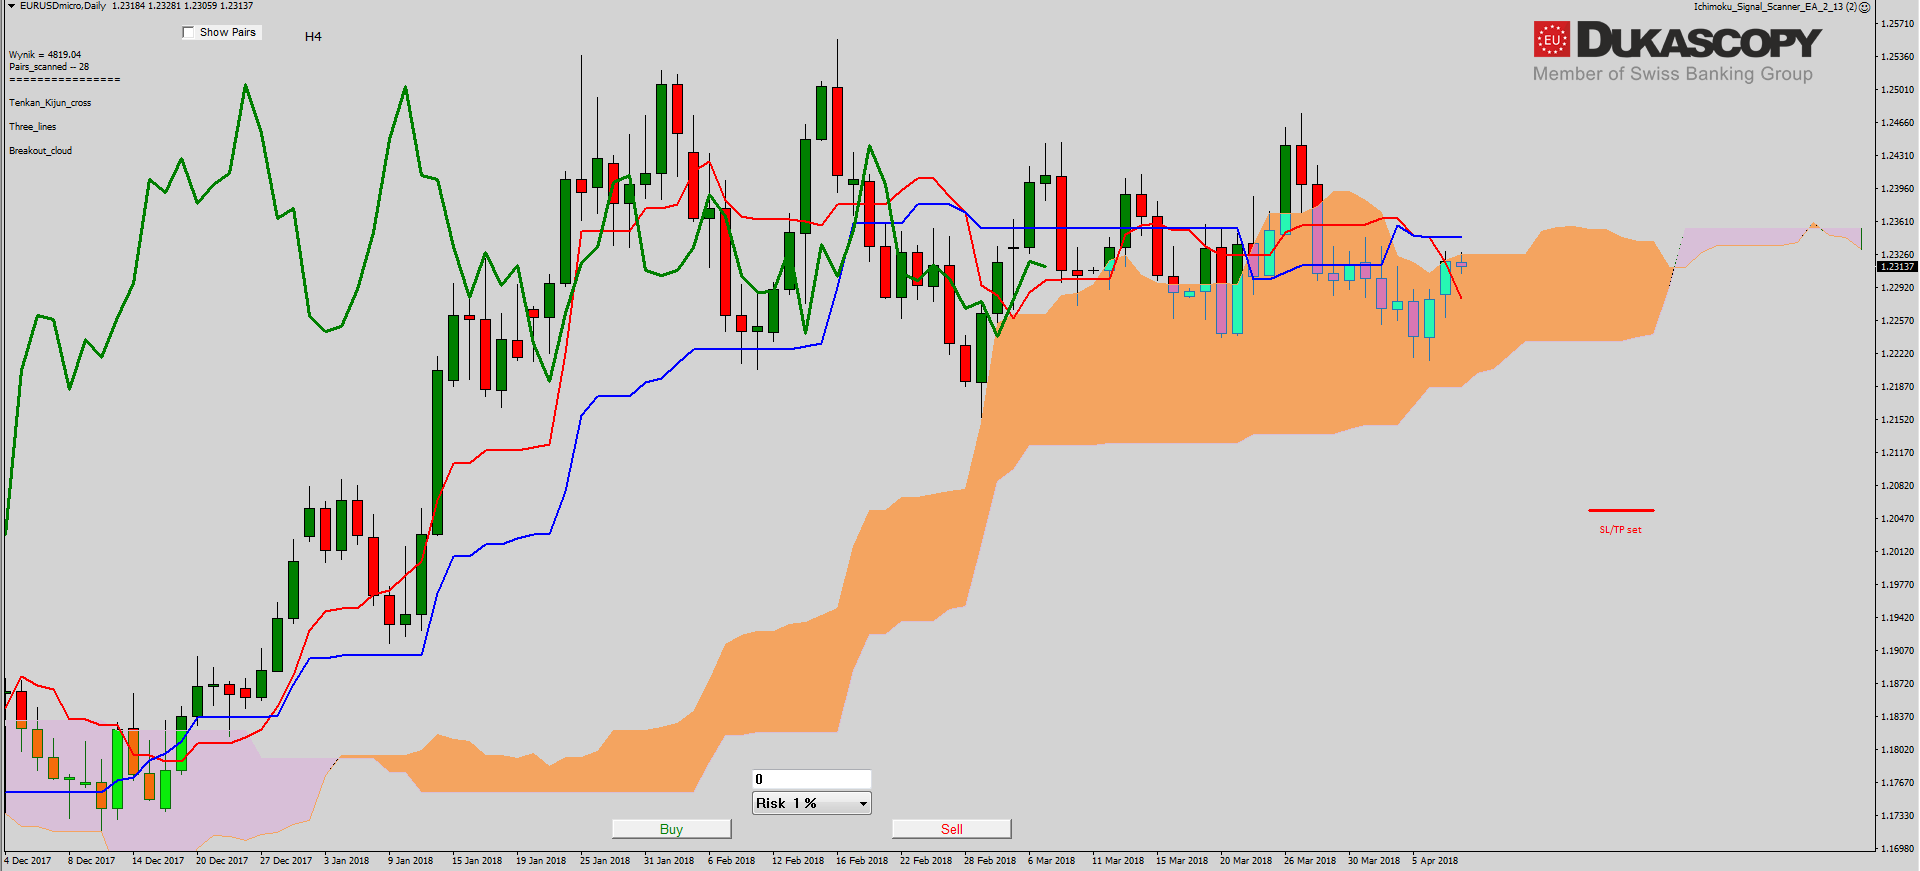
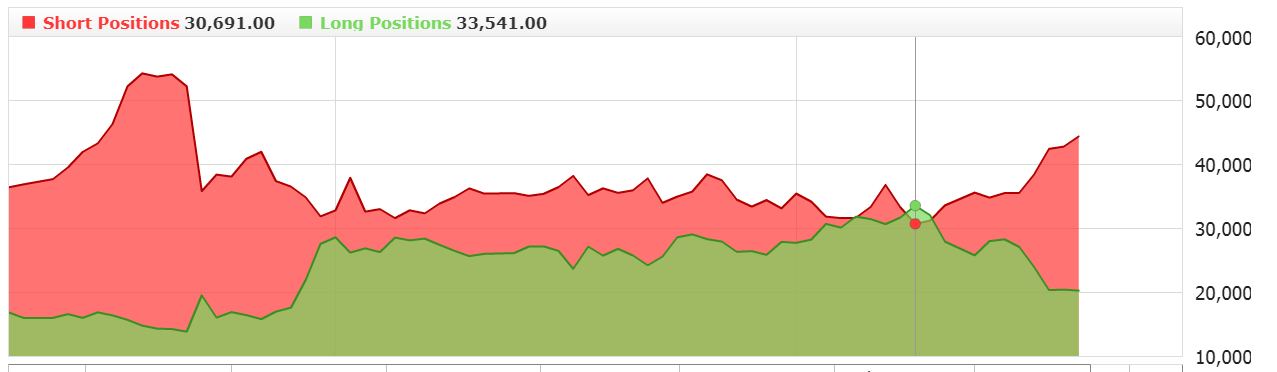 On the Ichimoku chart, the pair reached the Senkou Span line And Tenkan’s falling line. Their rejection may result in a movement towards the lower cloud limit. The Chikou line is located between Tenkan and Kijun and inside the price, which of course indicates the side movements. The scenario with the rejection of the tested lines is supported by the sentiment, where we see a clear increase in short positions. On the H4 chart, the pair tests the Senkou Span A lines in the bearish cloud. Her rejection and descent below Kijun and Tenkan may be an opportunity to play under dips.
The partner of “Search, Analyse, Trade” series is a Dukascopy Europe broker who gives its customers access to ECN accounts in different currencies.
Trade on Forex, indices and commodities thanks to Swiss FX & CFD Marketplace. Open free trading account right now.
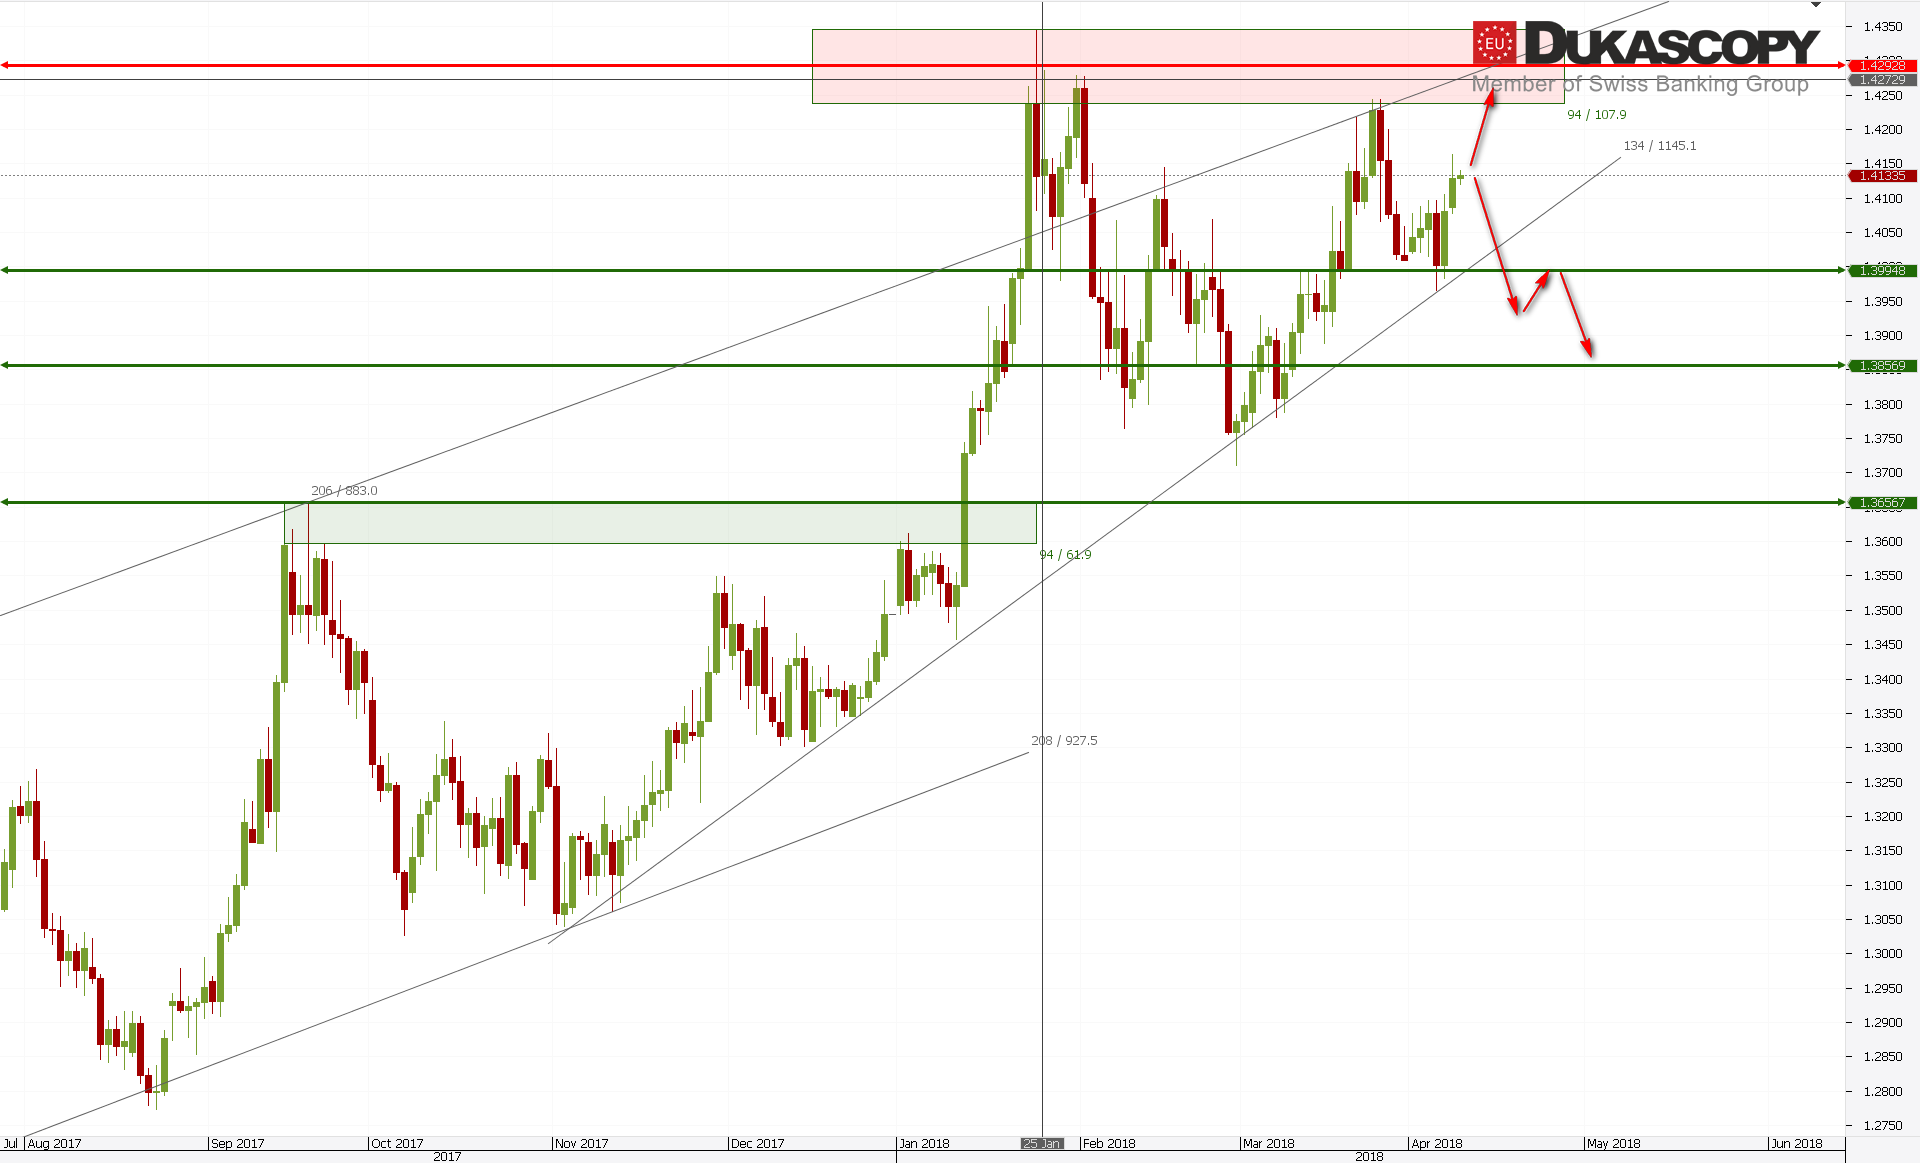
GBP/USD continues to move upward after rejection of the trend line. This movement can be both the beginning of another upward wave, which will test the key resistance zone, as well as the c wave in the correction of the irregular wave B of the larger correction structure. After its completion, we should see declines based on the C wave.
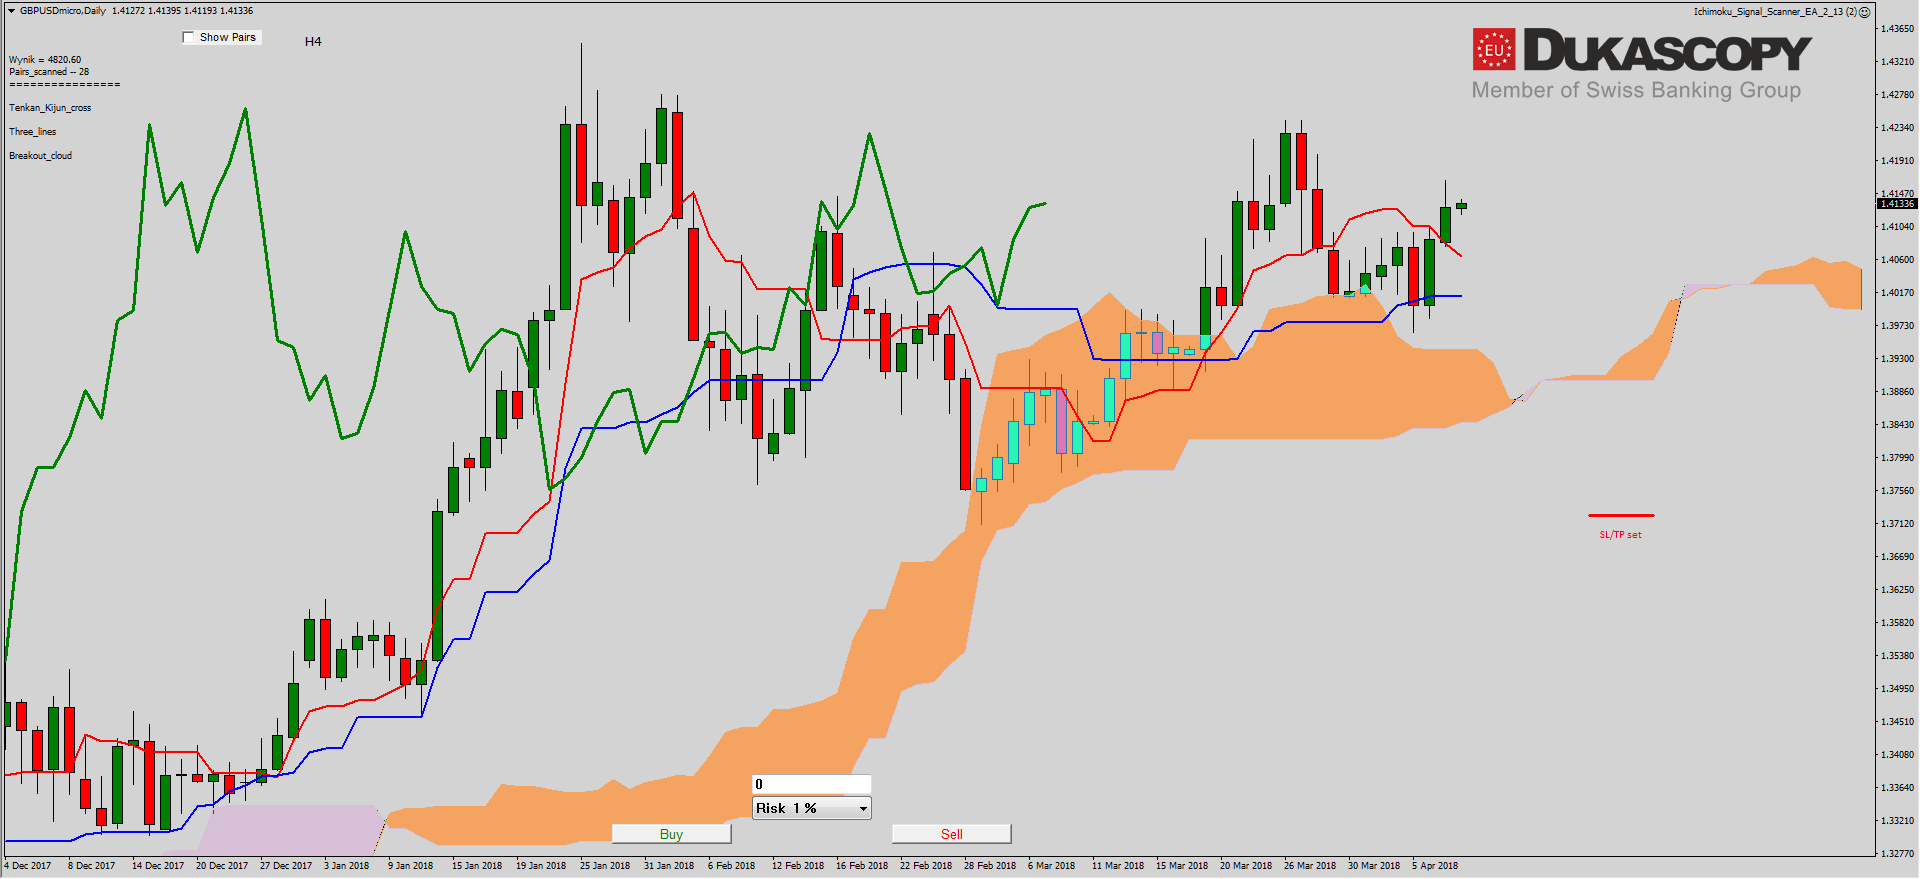
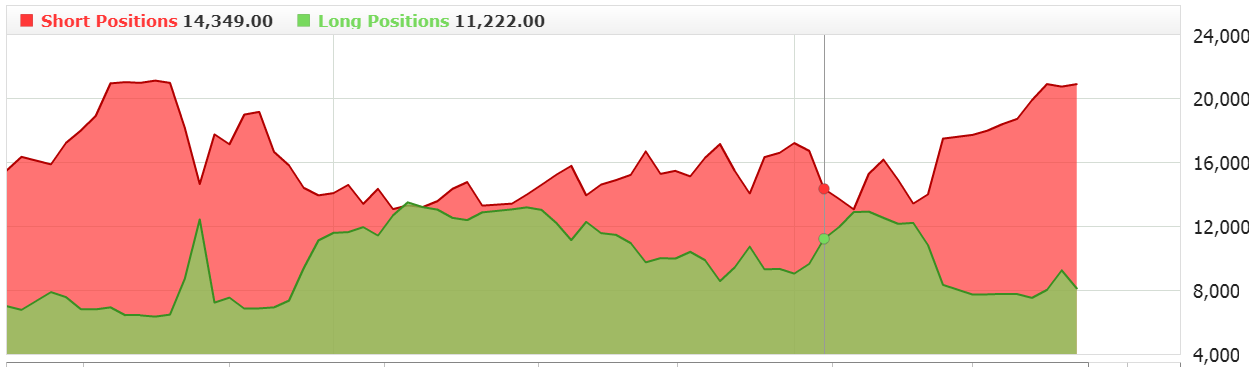
On the Ichimoku chart a signal of three lines was created, i.e. a buy signal. The pair was above the Tenkan and Kijun lines. The Chikou line confirms the bullish attitude and, after the re-test, Kijun found itself in a free space. The problem with such a signal is that the Tenkan line is down and the cloud is very thin. Of course, this can change in the near future. I am counting on the correction towards Tenkan and only after pair will reject it I will look for a long position. A drop below will increase the chance for a scenario with an irregular adjustment that sentiment supports. As in the case of EUR / USD also here we have a strong increase in short positions.


 Review")


