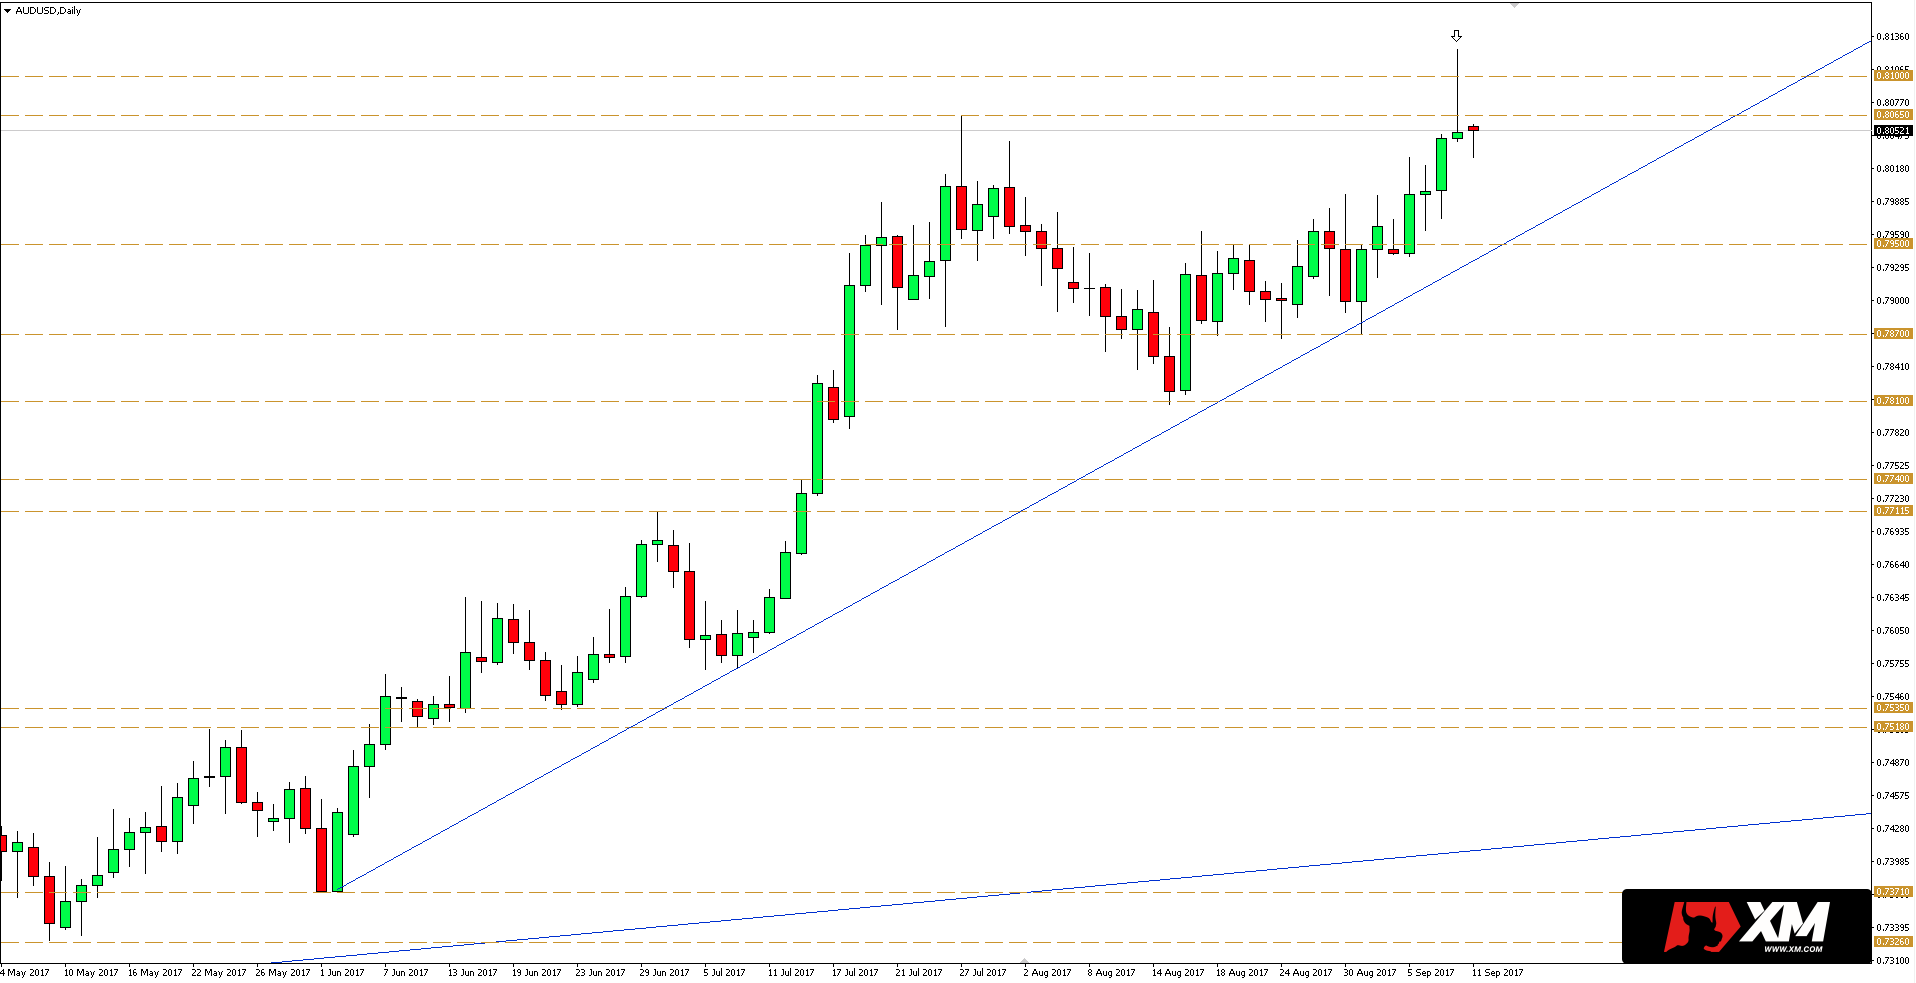
On the daily AUDUSD chart last Friday a bearish pin bar was created, which may indicate a potential correction of recent gains. In addition, the wick of this candle tests the resistance area between 0.8065 – 0.8100.
This is of course a counter-trend formation, so it is risky to speculate on declines. There is also not so much room for possible declines because quite close there is a line of bullish trend running from the minimum of June and horizontal level of 0.7950.
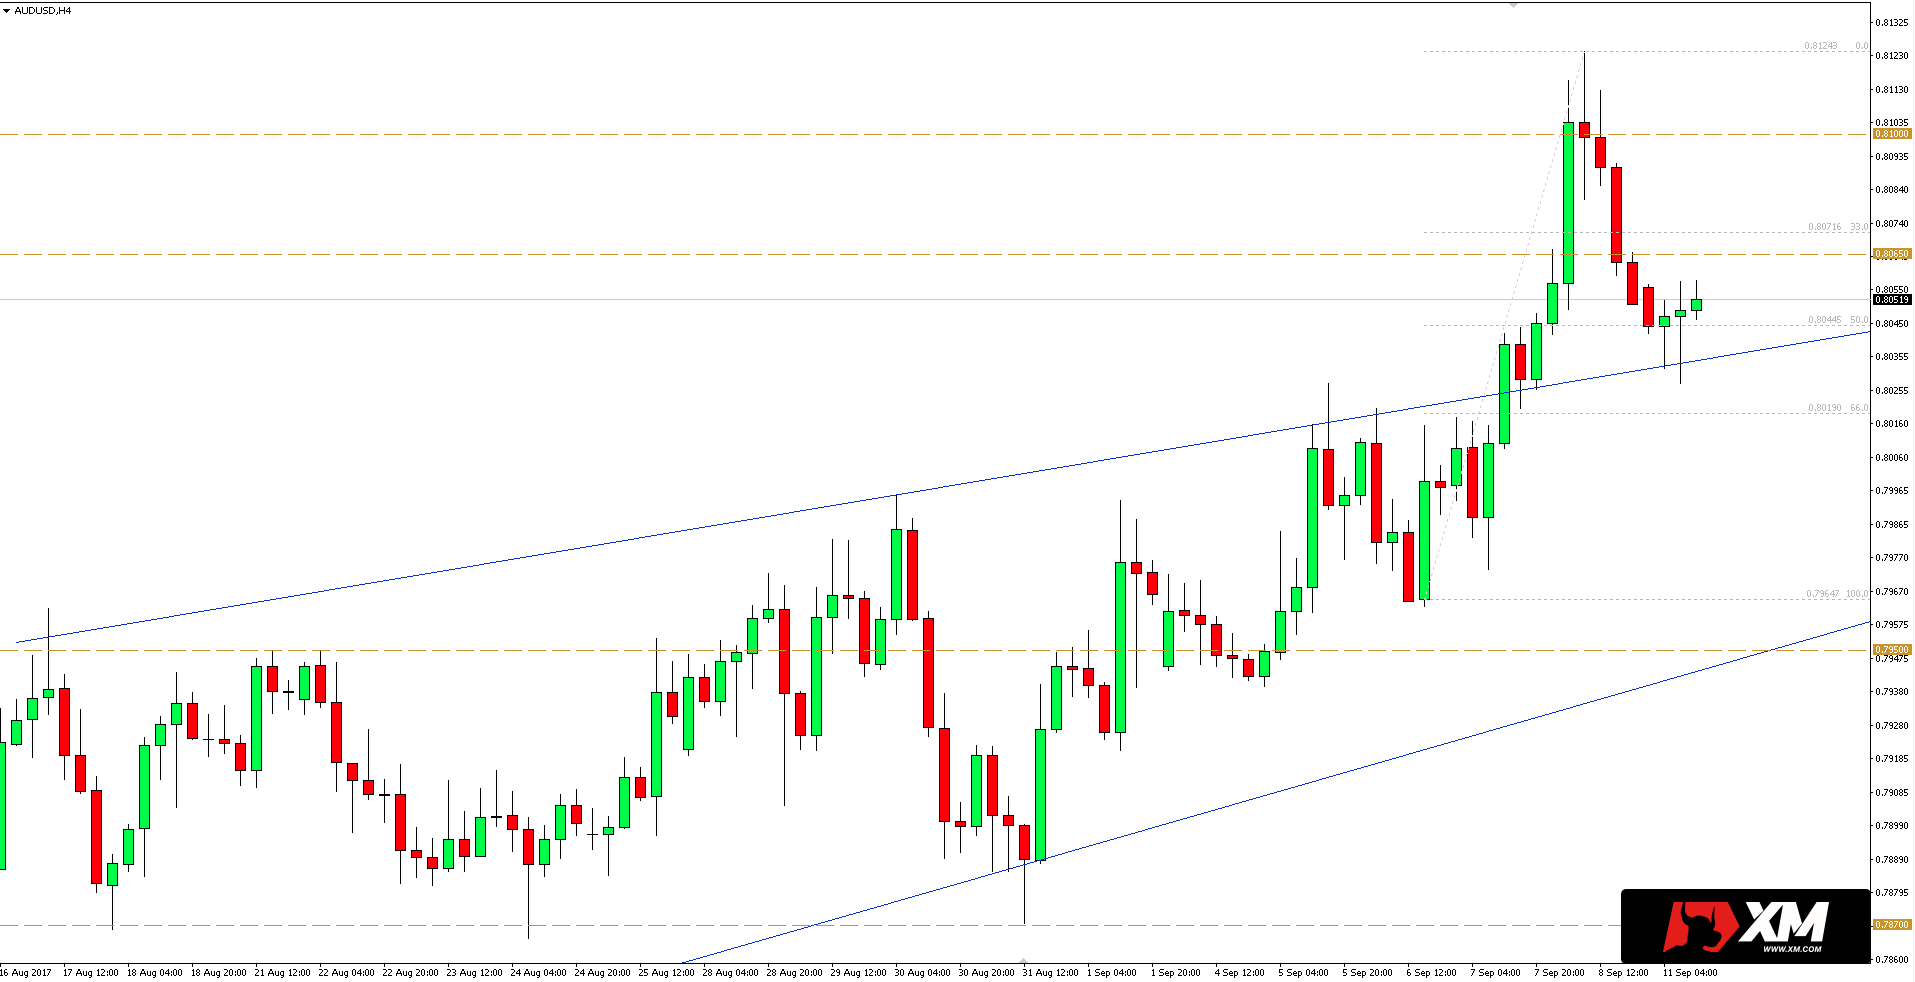
We have bullish attitude on the H4 chart, where the price after a strong growth impulse returned to support/50% of the abolition of this impulse. It may turn out that the pair will return to growth.
Buy signals can be awaited according to the only high and lows stategy. Despite the contradictory signal from higher interval (daily), the short-term trend of this pair is still bullish. However, before you decide to take a position, you should wait for a strong and correct signal.
I am trading on this instrument with broker XM, who has more than 300 instruments >> in his offer


 Review")


