 Most investors who first time come into contact with Forex market or binary options (BO) tend to choose the lowest possible intervals, counting on quick profits. In the article below we would like to present another – definitely safer approach to the BO – based on the end of the day strategy. Its main purpose is to play options expiring at the end of trading day.
Low intervals = high risk
Brokers of binary options now offer options for the most popular currency pairs, commodities and indexes expiring within 60 or even 30 seconds. While this can be an interesting way to invest and secure positions for experienced investors, for a newbie trader this can be to dynamic environment leading to a quick account wiping.
To get familiar with the market environment and how it works, it is definitely better to focus on options with longer expiry time. Great examples are intraday options that expire at the end of the day (usually between 21 and 24 depending on the session and the selected item).
What are the biggest advantages of this solution?
- Investor makes decisions based on H1 chart or higher – the technical situation is not so volatile and we have more time to make a decision.
- A clearer trend is drawn during the entire session or earlier – thus avoiding the risk of unnatural behavior during volatility due to macroeconomic data and underlying events.
- You can identify a longer market trend, which reduces the risk by giving you a greater advantage and a chance of effective closing options
- Overtrading protection – By investing in end of the day options, the investor is not in a position to over-trade as would be the case for short-term options (for example, a dozen transactions at the same price within a single session)
- Favorable return levels for options expiring at the end of the day – on average 80%.
Every day in the morning on Comparic.com we present two analyses for options expiring at the end of the day. The technical image is based on Price Action combined with S/R lines and trendlines. In the following strategy we would like to present a slightly different approach, using more technical analysis tools.
Basic assumptions of the end of the day strategy
The approach proposed in this article is based on several basic assumptions:
- Investing based on Price Action and its elemental formations
- Using H1 (hourly) charts – regardless of the MT4 platform provider, hourly candles always look the same (H4 graphs may differ significantly from each other due to the different server times). More sophisticated traders can also use the M5 interval to make a more precise entry into the transaction
- Use of pivot point (PP) and Fibonacci retracement in intraday analysis
- Investing in the most popular assets – the main currency pairs are characterized by the highest liquidity, the smallest amount of incorrect quotes, and the most favorable returns
- Limited exposure to a particular currency to reduce risk – Avoid placing multiple positions, for example Pound (PUT GBP/USD, PUT GBP/JPY and CALL EUR/GBP). In this case, when the market moves “wrong” direction than expected, all positions will be a loss. Therefore, it is important to choose different currency pairs
- Analyses are made in the morning – preferably before 12:00. Alternatively, they can also be done in the afternoon, but not later than 3 hours before the option expires.
Preparing the chart
At the very beginning, we need a Pivot Point (PP) indicator. It is not available by default on most MetaTrader platforms, but there are plenty of free and nice looking versions on the net. The indicator used in this article can be downloaded from here (link). Indicator shows main pivot point, three support and resistance pivots (S1-S3, R1-R3, and so-called mid-pivots).
In addition to the PP itself, the graph is also supplemented by SMA (simple moving average) with interval 33 and shift 0. As a result, the graph should now look like this:
Once the graph is ready, you can focus on its proper analysis. Below you will find the rules for PUT and CALL options
The conditions necessary to open the PUT option – expecting declines
The end of the day strategy for the PUT option assumes the following assumptions:
- Extension of the Fibonacci corrections on the price of the previous day session. If the session is bearish, the indicator is stretched from maximum to minimum, if it was bullish we do it opposite way. Fibonacci in this case is an additional confirmation of relevant technical levels that can trigger a reflection of the price.
- The session should start under daily PP and 33SMA (pink dashed line called Pivot and dynamic moving average). When the Pivot line overlaps with the support/resistance of previous sessions, investor receives an additional confirmation of the significance of the level
- At the moment of testing the daily PP level from below, the PUT option is considered. When the zone coincides with 33SMA and Fibonacci abolition, the signal is stronger
- It is important that a signal from Price Action (for example pin bar) appears on the resistance zone, which is an additional confirmation of the position.

The above example shows PUT option explained step by step:
- The previous session was bearish – Fibonacci stretched from top to bottom
- Another session began under Pivot and 33SMA levels, so we are expecting declines (PP additionally coincided with a 38.2% abolishment of the previous day’s declines).
- Due to the fact that price was far from the set resistance levels, in the morning it was impossible to make a trading decision.
- Such an opportunity appeared only in the afternoon when price falsely tested the confluence of resistance in the form of 33SMA, PP and Fibo 38.2%. In addition, at that level a pin bar candle was created.
- Once it was closed, you could open the PUT option
- The price until the expiration of the option (21:00) dropped 30 pips, the position was booked as profitable
Conditions required to open the CALL option – on growth
The end of the day strategy for the CALL option assumes the following assumptions:
- Fibonacci stretched the same way as in the PUT option
- The session should begin over a daily PP level and 33SMA (pink dashed line called Pivot and dynamic moving average). When the Pivot line overlaps with the support/resistance of previous sessions, the investor receives an additional confirmation of the significance of the level
- At the moment of testing of the daily PP level, the opening of the CALL option is considered. When the zone coincides with 33SMA and Fibonacci cancellation, the signal is stronger
- It is important that a signal from the Price Action (for example, the pin bar) appears on the support zone, which is an additional confirmation of the bullish attitude.
The above example of playing the CALL option is explained step by step:
- The earlier session was bullish – Fibonacci stretching from minimum to maximum of the day
- The first opportunity to open the CALL option came in at night when we had the first PP test and 38.2% of the Fibo correction – at this time usually no one trades
- The real commercial opportunity appeared in the afternoon (second candle marked in red)
Very long bottom wick falsely broke 33SMA, PP and 38.2% of Fibonacci - Once the H1 candle was closed, it gave a signal to open option CALL. The price until closing time increased 30 pips, so the option was profitable.
The above examples show the exact rules for playing the OB based on the end of the day strategy. Here are some additional examples based on the strategy described, including the moments when this option should not be opened.
Examples of setups based on the end of the day system
In the above we could see two book examples of CALL and PUT options based on the end of the day strategy. However, it should be mentioned that such situations will not happen every day – much more often the market will show signals of lesser strength, but still having high profit potential. Few examples of such systems are presented on charts below.
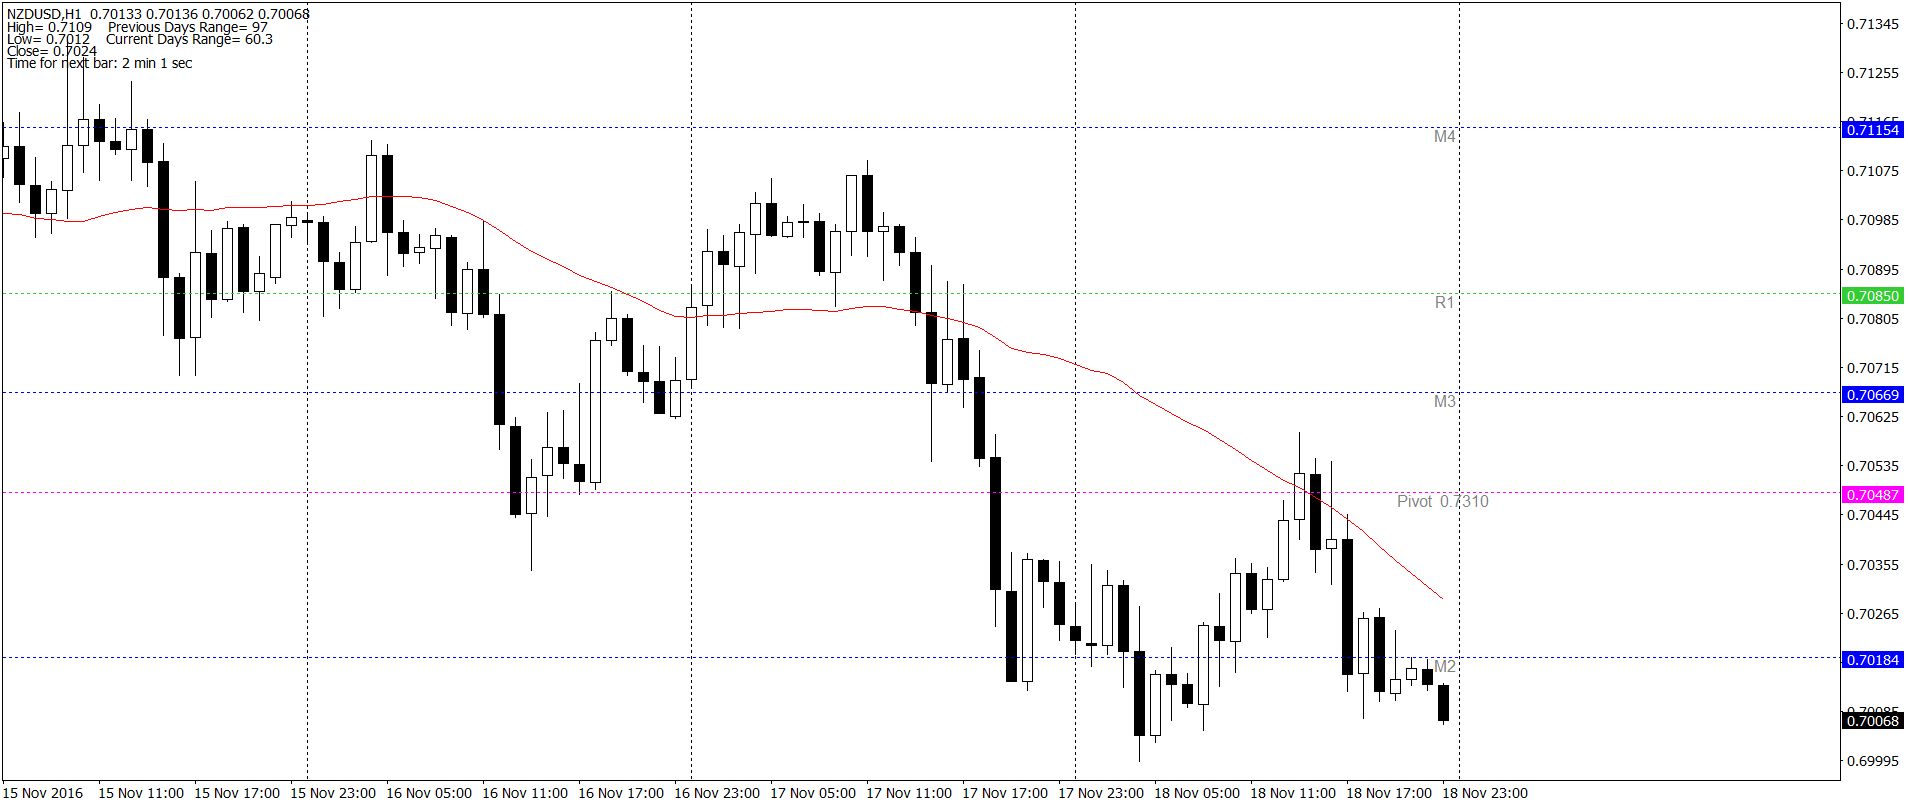
Option CALL for USD/JPY
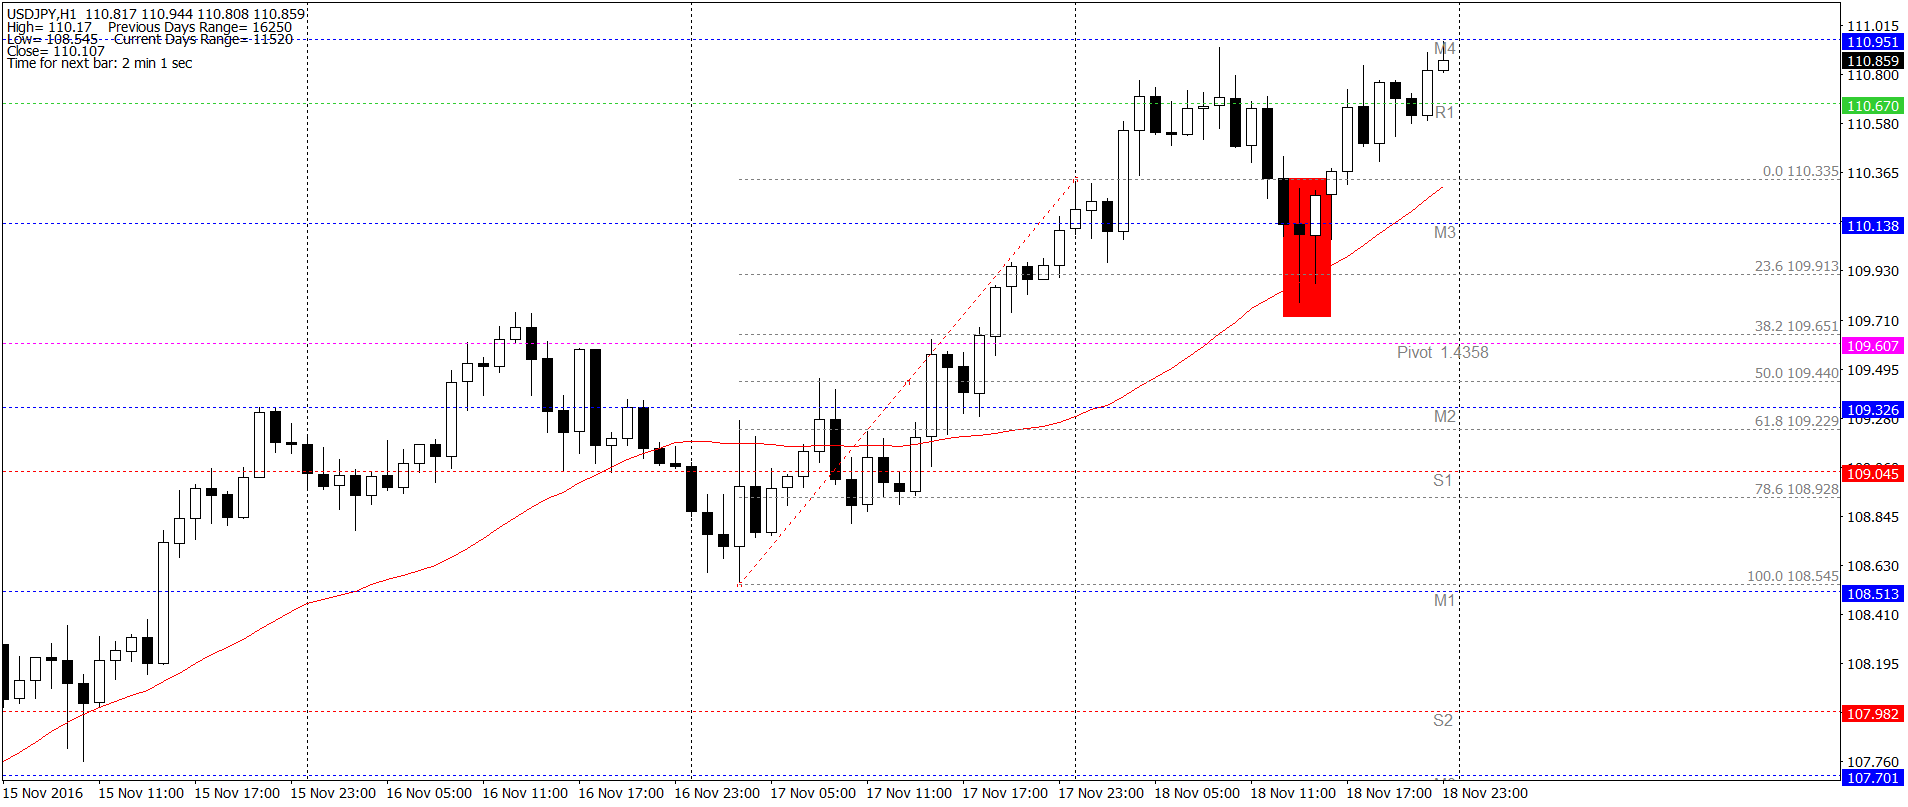
Session earlier was bullish so Fibonacci stretched up. The quotes are open over 33SMA and PP so the investor is betting on growth. However, during the day test of the daily Pivot doesn’t occur – does it completely excludes trade? Not necessarily. This is why additional Pivot levels (standard deviations of the main pivot) are also used, which are denoted S1-S3 and M0-M5. In this case Price Action formation (pin bar + inside bar) tested 23.6% of Fibonacci, 33SMA and mid pivot M3. After finishing the formation, trader was given the signal to open CALL option – which would close at the end of the day with a profit.
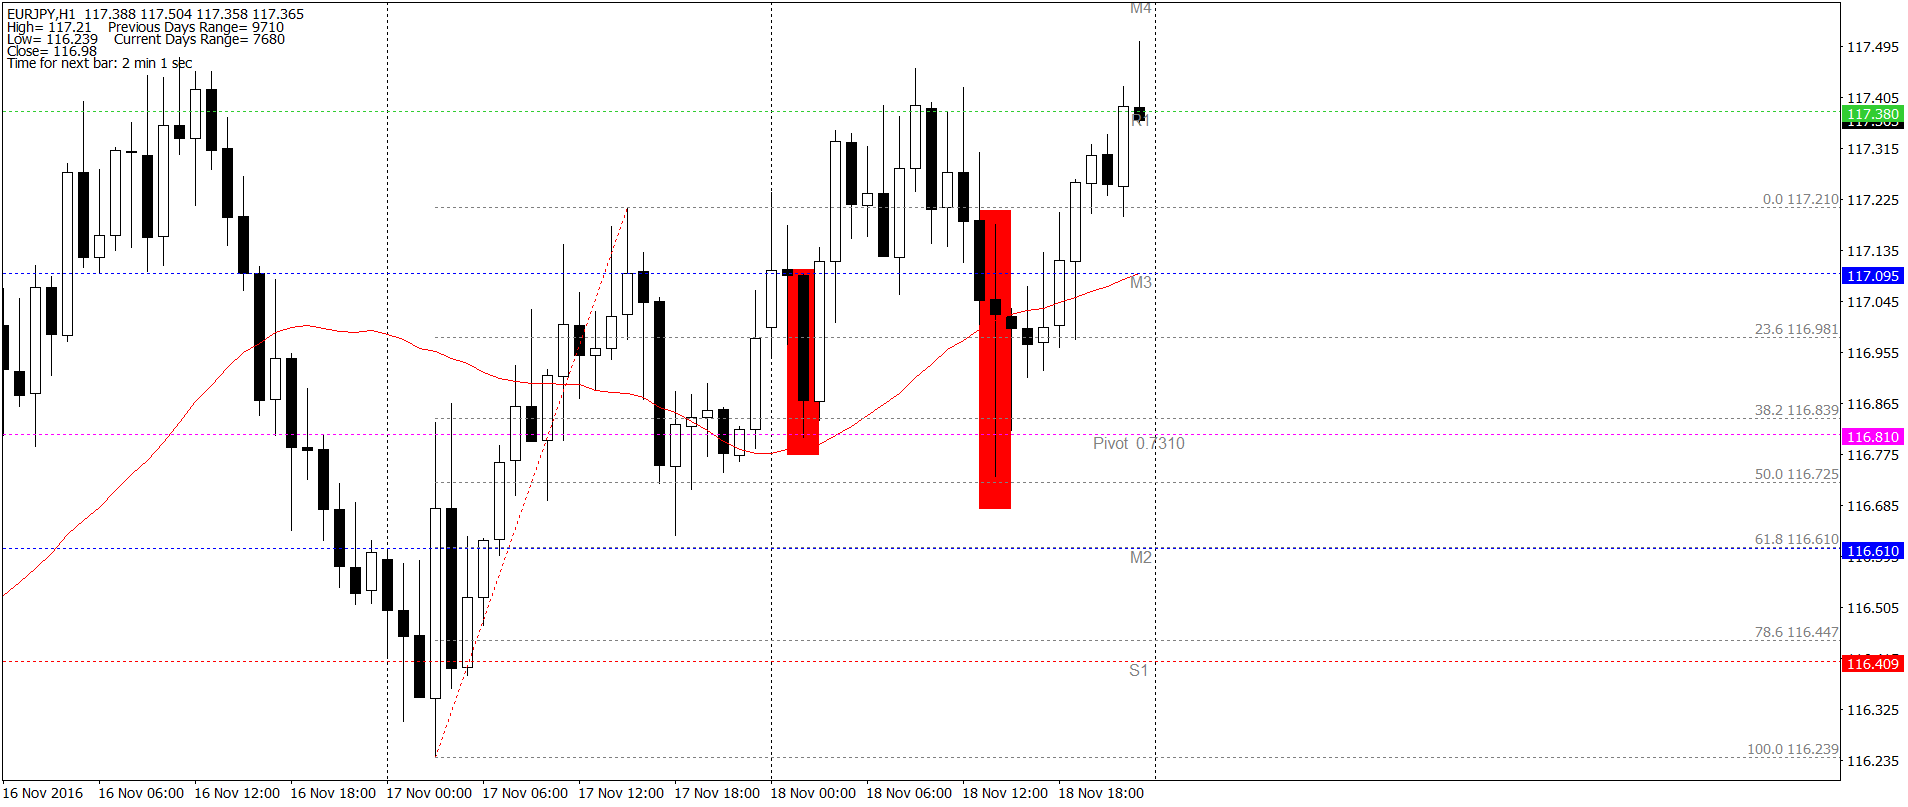
No option on EUR/USD

On H1 chart of EUR/USD Fibo, Pivot and 33 SMA suggested declines. However the candle signal on was not fulfilled on confluence of resistance and additionally Pivot S1 did not allow the price to drop bellow to the end of the session. There was no signal and no opened option.
Option PUT on GBP/USD
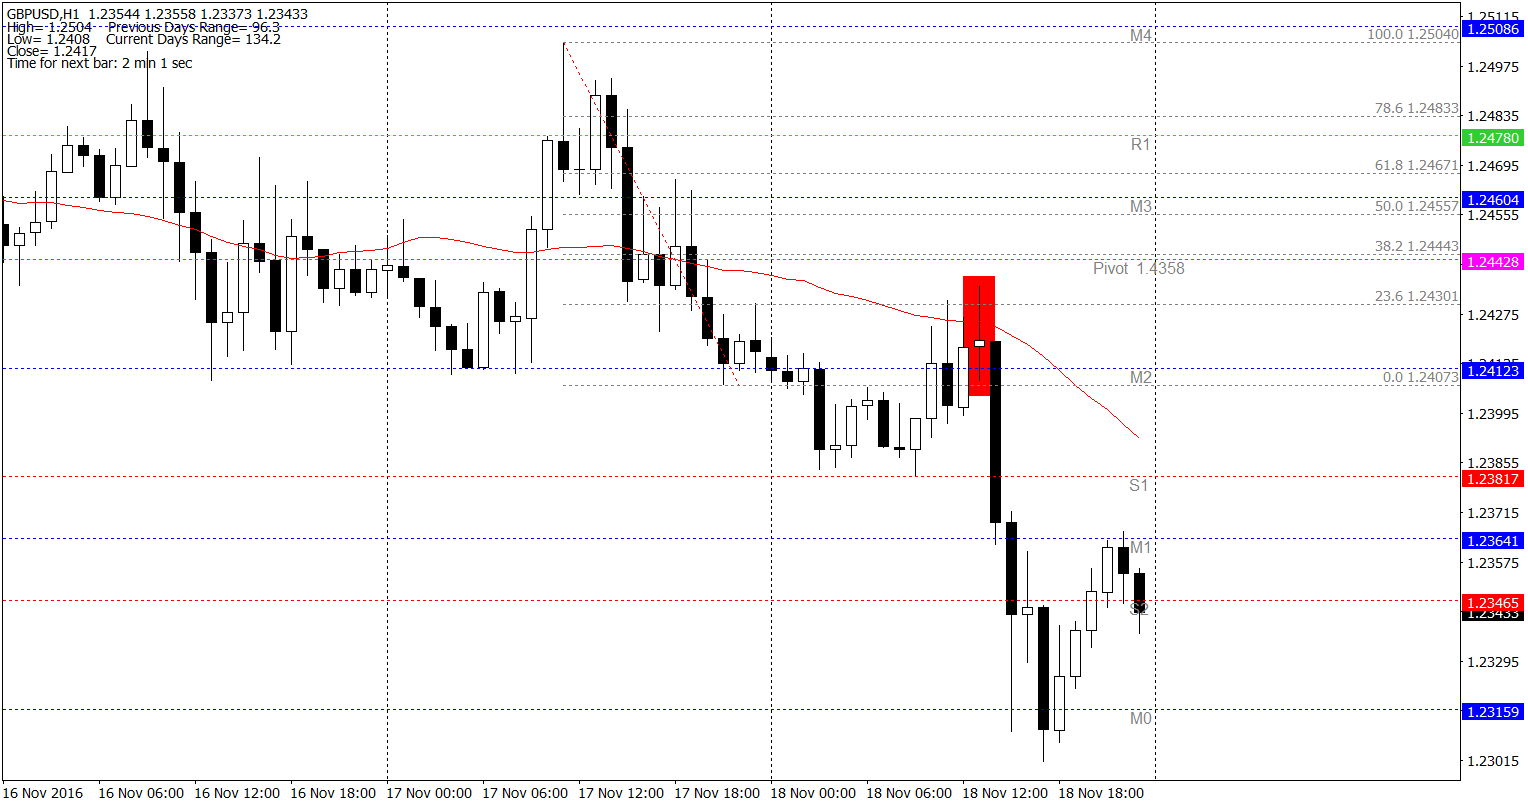
Example of far from the ideal signal – although the marked red candle tested 33SMA and Fibonacci resistance, it did not touch the Pivot level while staying over the pivot M2. Investor could, however, consciously assume a higher risk and open PUT position based solely on these signals. On the chart above, this would be the right solution, because the price at the end of the day actually closed lower, guaranteeing profit from the option.
CALL option on AUD/JPY – Failed

An example of a failed option – although the pin bar tested from the top PP and 50% of the Fibo correction, it was below 33SMA. Initially, the price moved up, but during the European morning it stopped at the first pivot resistance (R1), which caused the declines to the end of the day – resulting in CALL option closed with loss.
CALL option on CAD/JPY
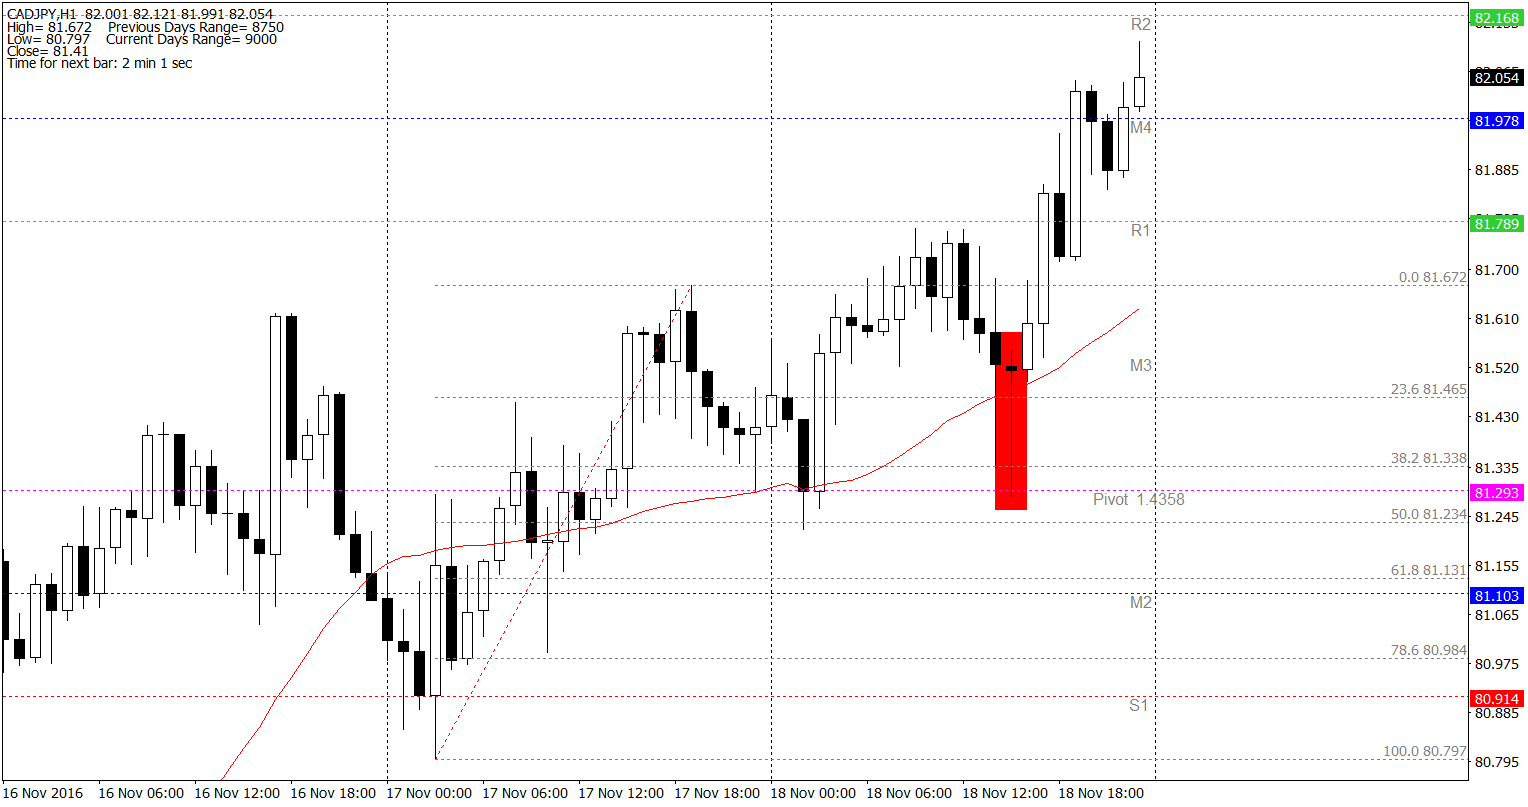
Another textbook example of the CALL option. All assumptions fulfilled (Fibo, PP and 33SMA test), additionally pin bar signal – option closed with profit.
For the next two weeks on Comparic.com we will present analyses and possible actions based on the above strategy and we will try to check its effectiveness. The results will be published on Saturday, 23.09.2017.


