AUDUSD after reaching support at 0.7330 at the end of June this year was in consolidation. As can be seen in the daily chart below, the candles often cut through the middle Bollinger band and the outer bands formed a narrow range.
I trade on this instrument at broker XM, which has in its offer more than 300 other assets >>
However, the situation changed at the end of the week. On Thursday, the rate rebounded from the downward trend line running from this year’s lows. Additionally, the chart created a bearish outside bar, which engulfed candles from the previous two days.
The sell-of was continued during the Friday session when pair closed under key support at 0.7330. In addition, the quotes have crossed the outer Bollinger band and are also under it while writing the analysis.
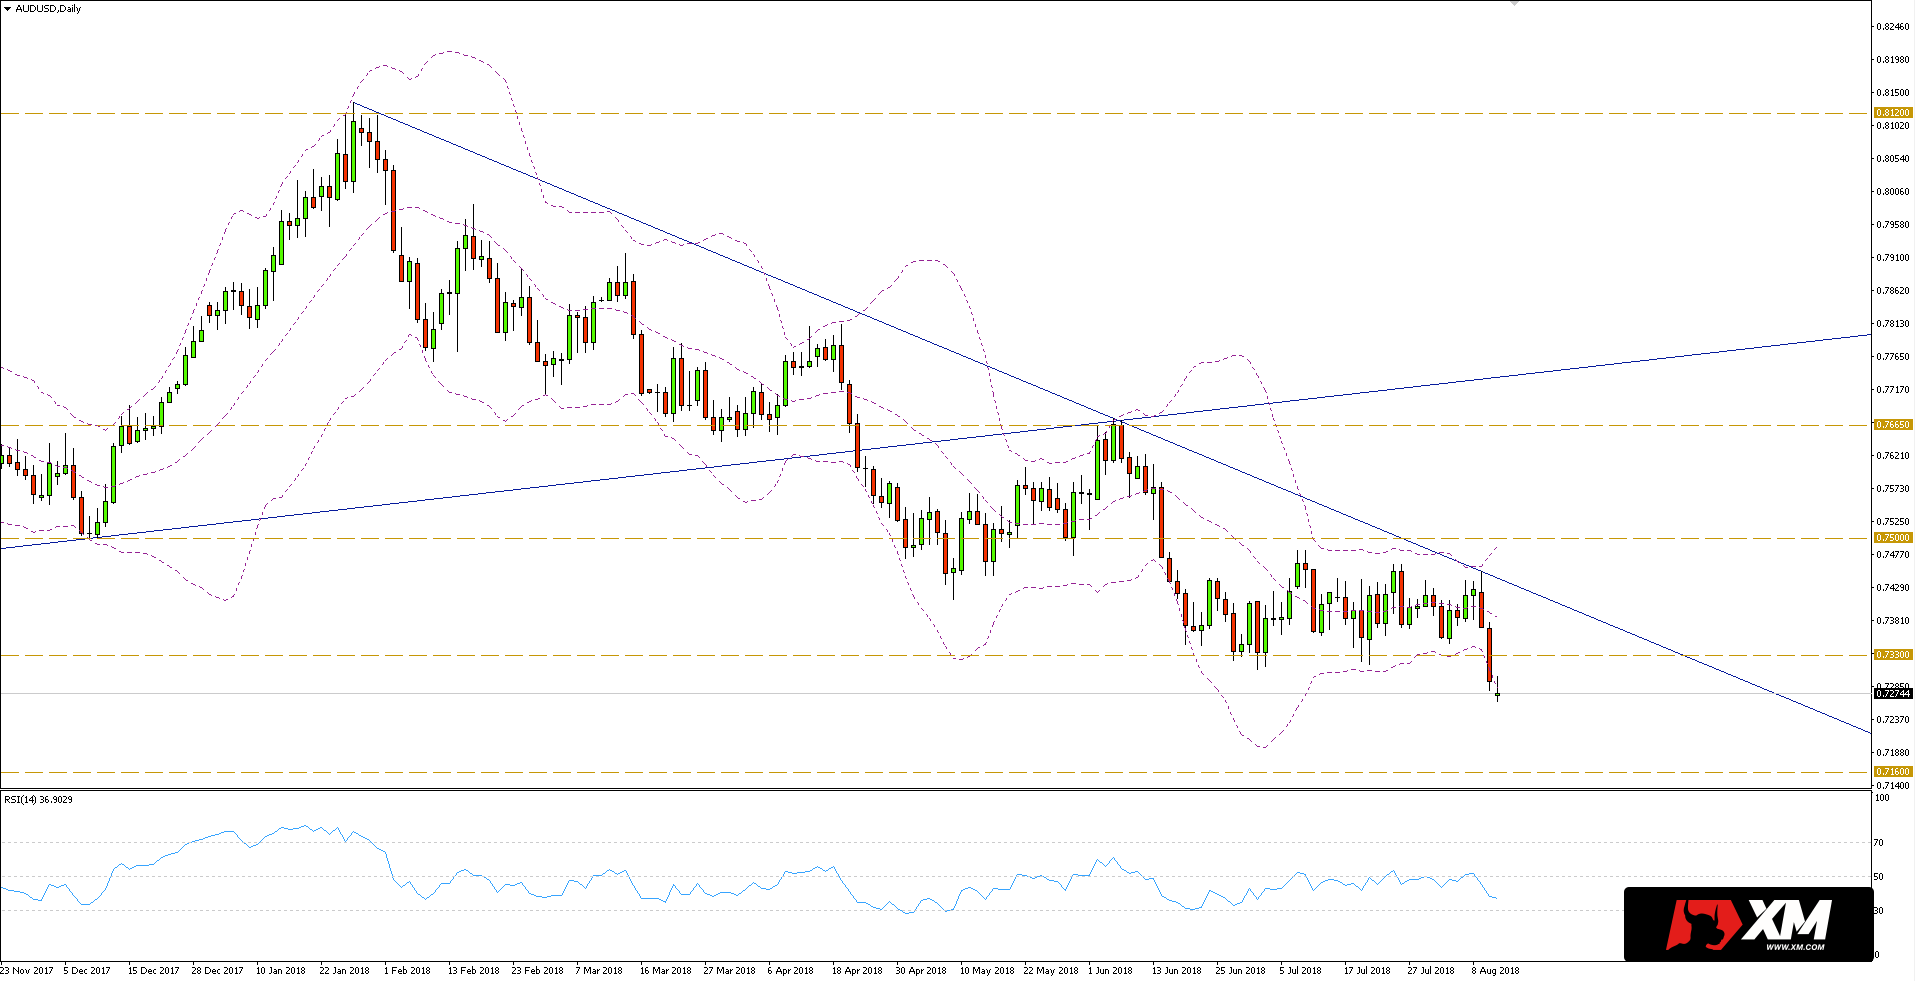
The bottom breakdown is in line with the direction of the dominant trend and opens the way to another key defence level at 0.7160. Traders can now look at sell opportunities after rebounds to horizontal levels or dynamic resistance.


 Review")


