CADCHF have been grappling with a key resistance area of nearby 0.7910 since September last year. As can be seen in the weekly chart below, this zone has already held back increases in March and April 2015.

After switching to the daily chart, we can see that yesterday the breakdown of the support established by the trend line extending from low of the second half of July last year was confirmed.
I trade on this instrument at broker XM, which has in its offer more than 300 other assets >>
This price action indicates potential for further falls. The closest support that was revealed after breaking the trend line is around 0.7530. The next significant levels are visible at 0.7400, 0.72700 and 0.7125.
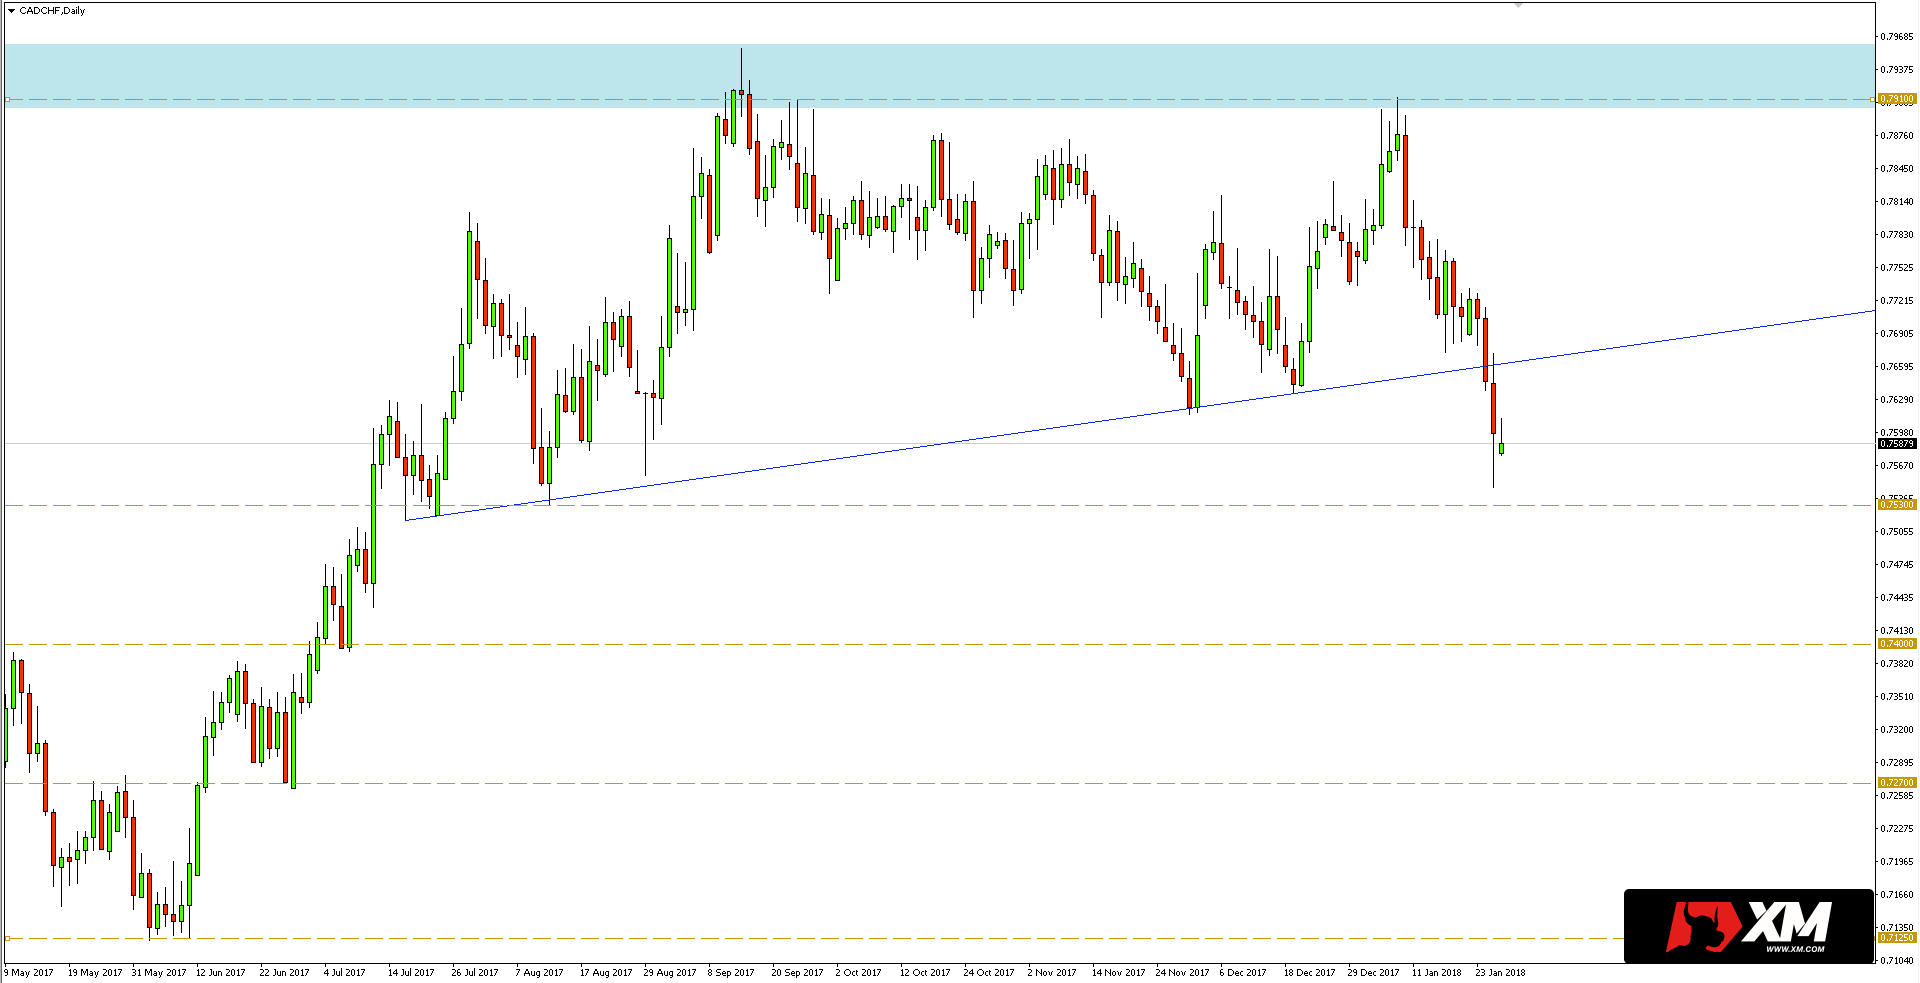 As the quotes quite dynamically dropped from the resistance at 0.7910, it is possible that a correction will appear before further declines, and the trend line, which is now a resistance, will be tested from the bottom. The sell signal during such a test can be used to occupy short positions, if it appears at all.


 Review")


