NZDJPY at the beginning of the current month was again testing support around 74.54. As you can see in the weekly chart below, this test caused a reflection and the price is setting new maximums for three weeks. Currently, a 20-week average (SMA) is tested, which provides dynamic resistance and, as seen above, has already proved itself in this role during an earlier correction. It is possible that this time it will be a similar situation.
 I trade on this instrument at broker XM, which has in its offer more than 300 other assets >>
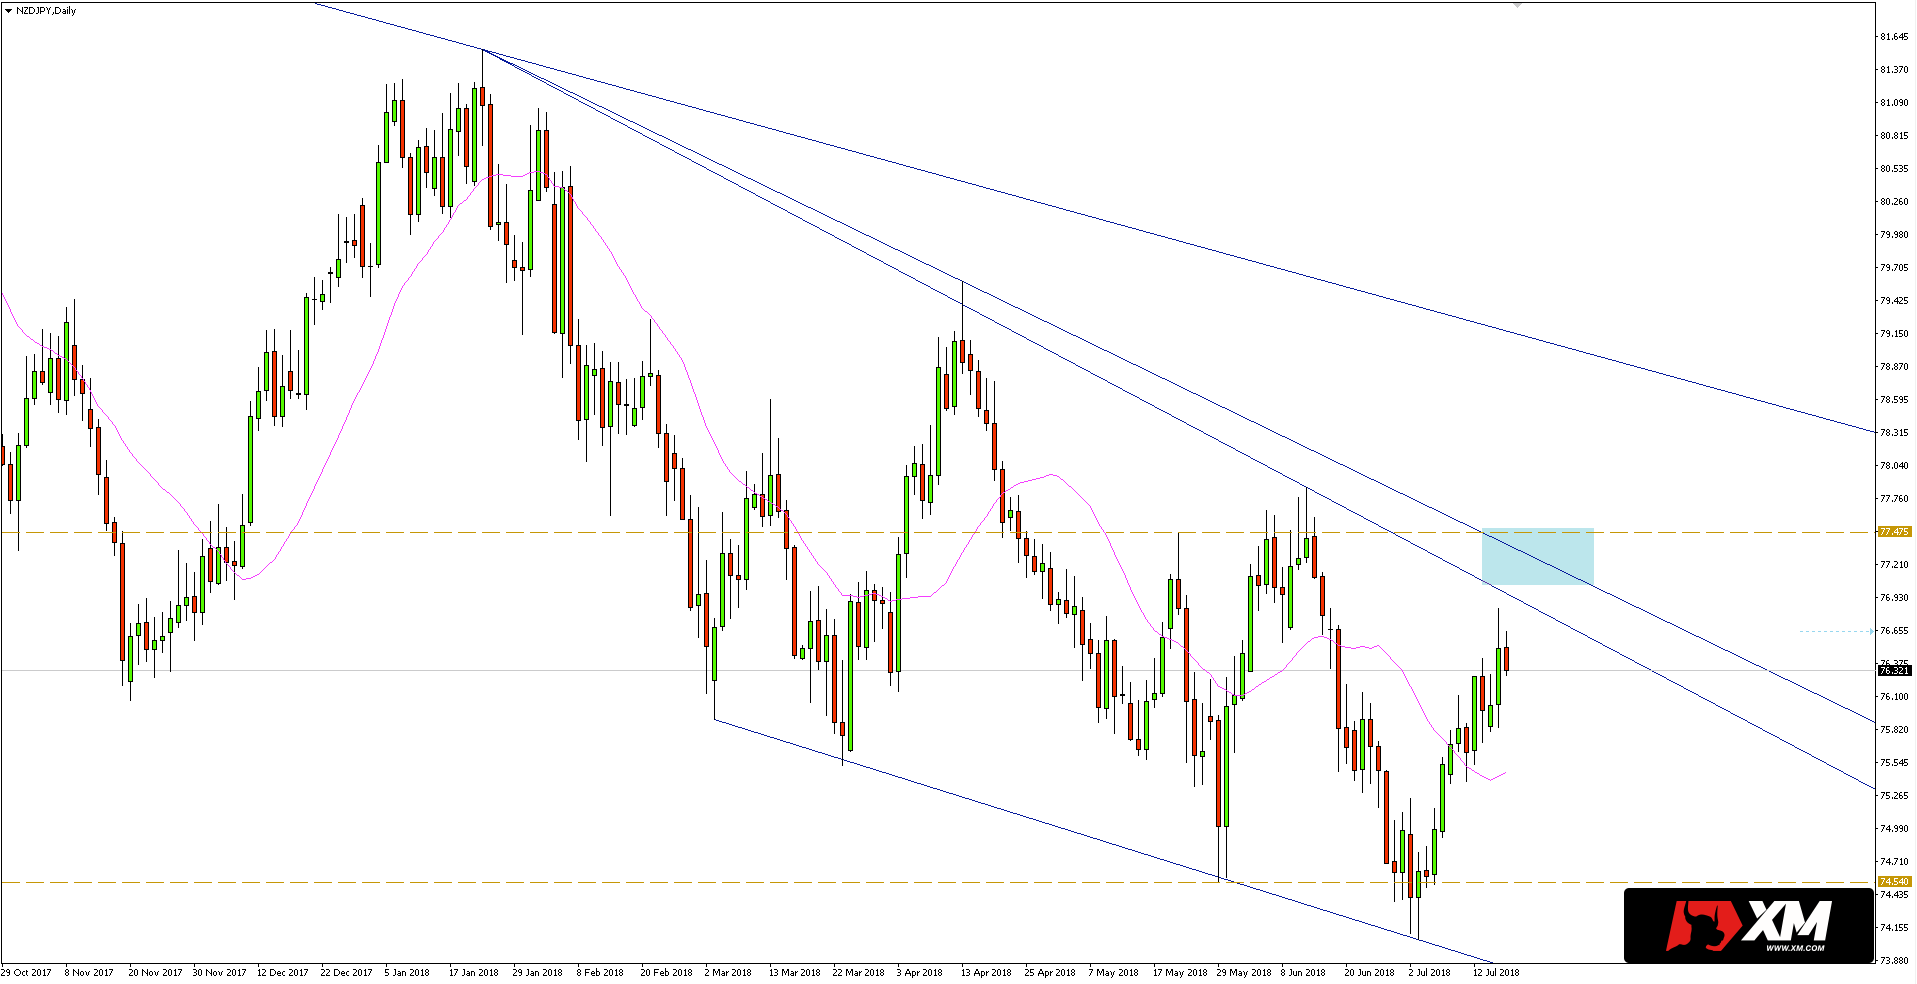
In turn, after switching to the daily chart, we have a resistance confluence, where the horizontal level close to 77.48 coincides with the accelerated trend line / wedge resistance running from this year’s highs. If this zone again acts as a resistance, sellers can take the direction to support at 74.54. Alternatively, defeating confluence would open the way for growth to the nearest resistance which is the trend line that has its beginning at the 2017 high.


 Review")


