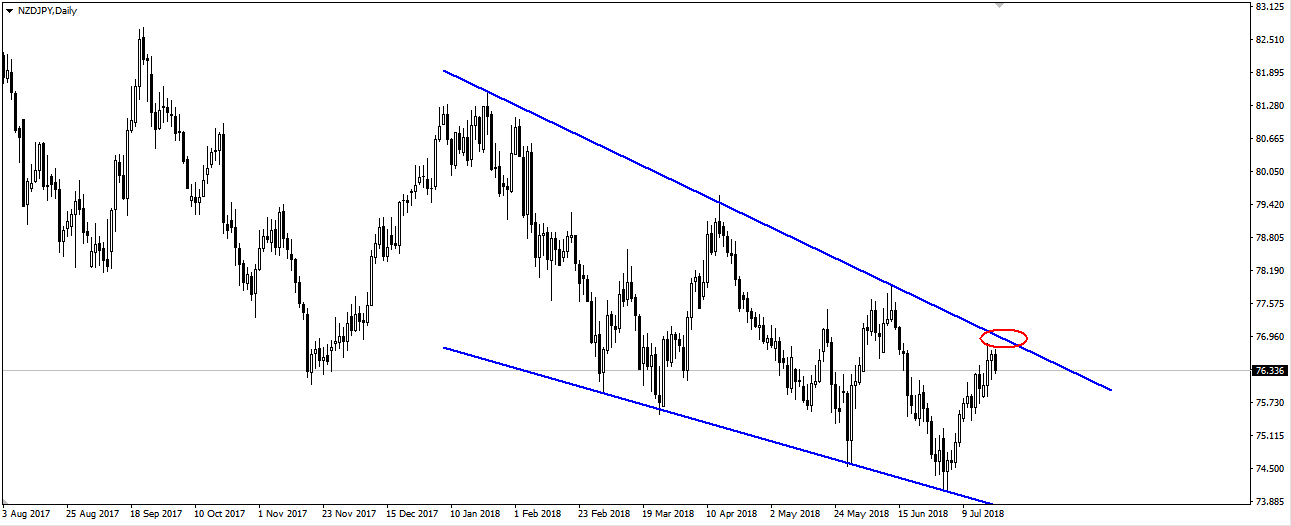
NZD/JPY is moving in a very technical way on the daily chart from the end of January. In the first half of the year, the edges of the wedge formation are perfectly respected. Currently, the price reached the top edge. Potentially there is, therefore, a supply place, and judging by the smooth and substantial swing from the past, you can expect quite large declines. It is also interesting on the W1 chart. You can see a pattern there, namely, no upward movement lasted 3 full weeks. Tomorrow ends third bullish week in a row. Theoretically, next week, next to the upper edge, one can expect a signal that indicates the activity of the supply side.
I trade on this instrument at broker XM, which has in its offer more than 300 other assets >>


 Review")


