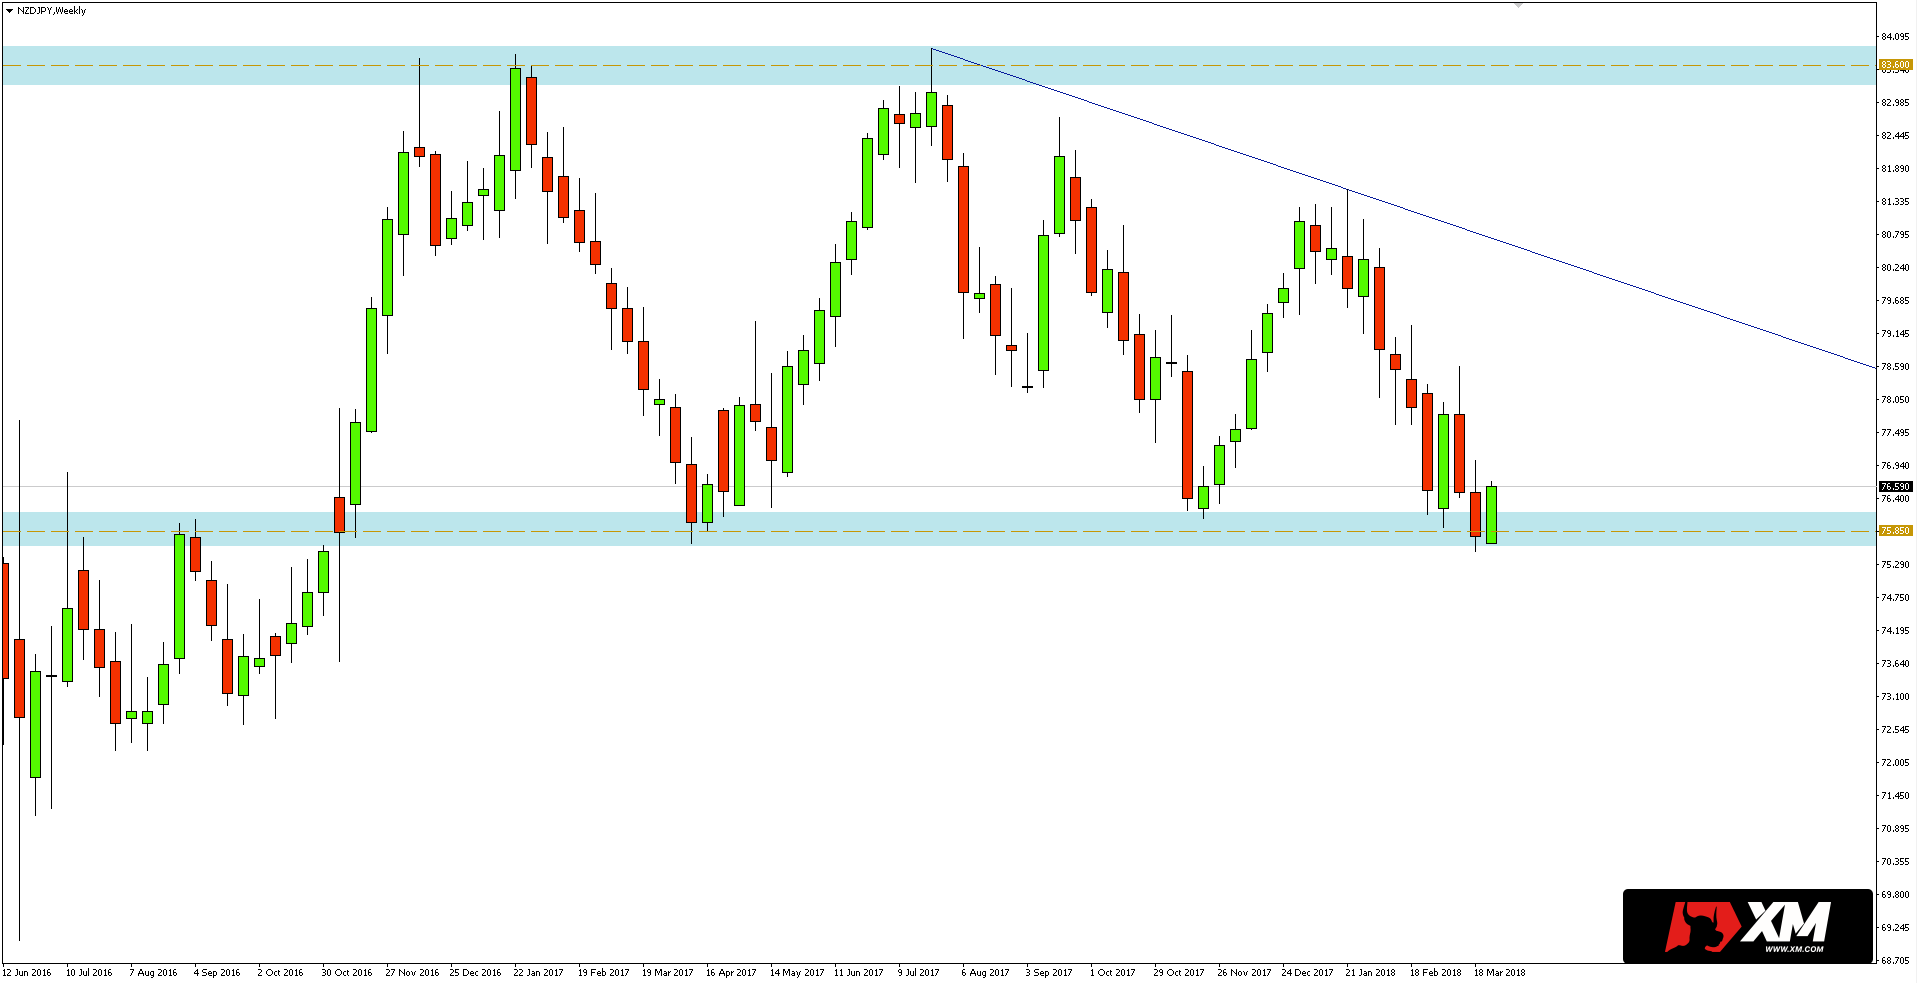
NZDJPY have been moving in a wide range for more than a year, the upper limit of which is the zone in vicinity of 83.60, while the support provides an area close to 75.85.
As you can see on the weekly chart below, the price has been struggling with support for few weeks. However, it has not been able to successfully defeat it yet, which still gives a chance of reflection.
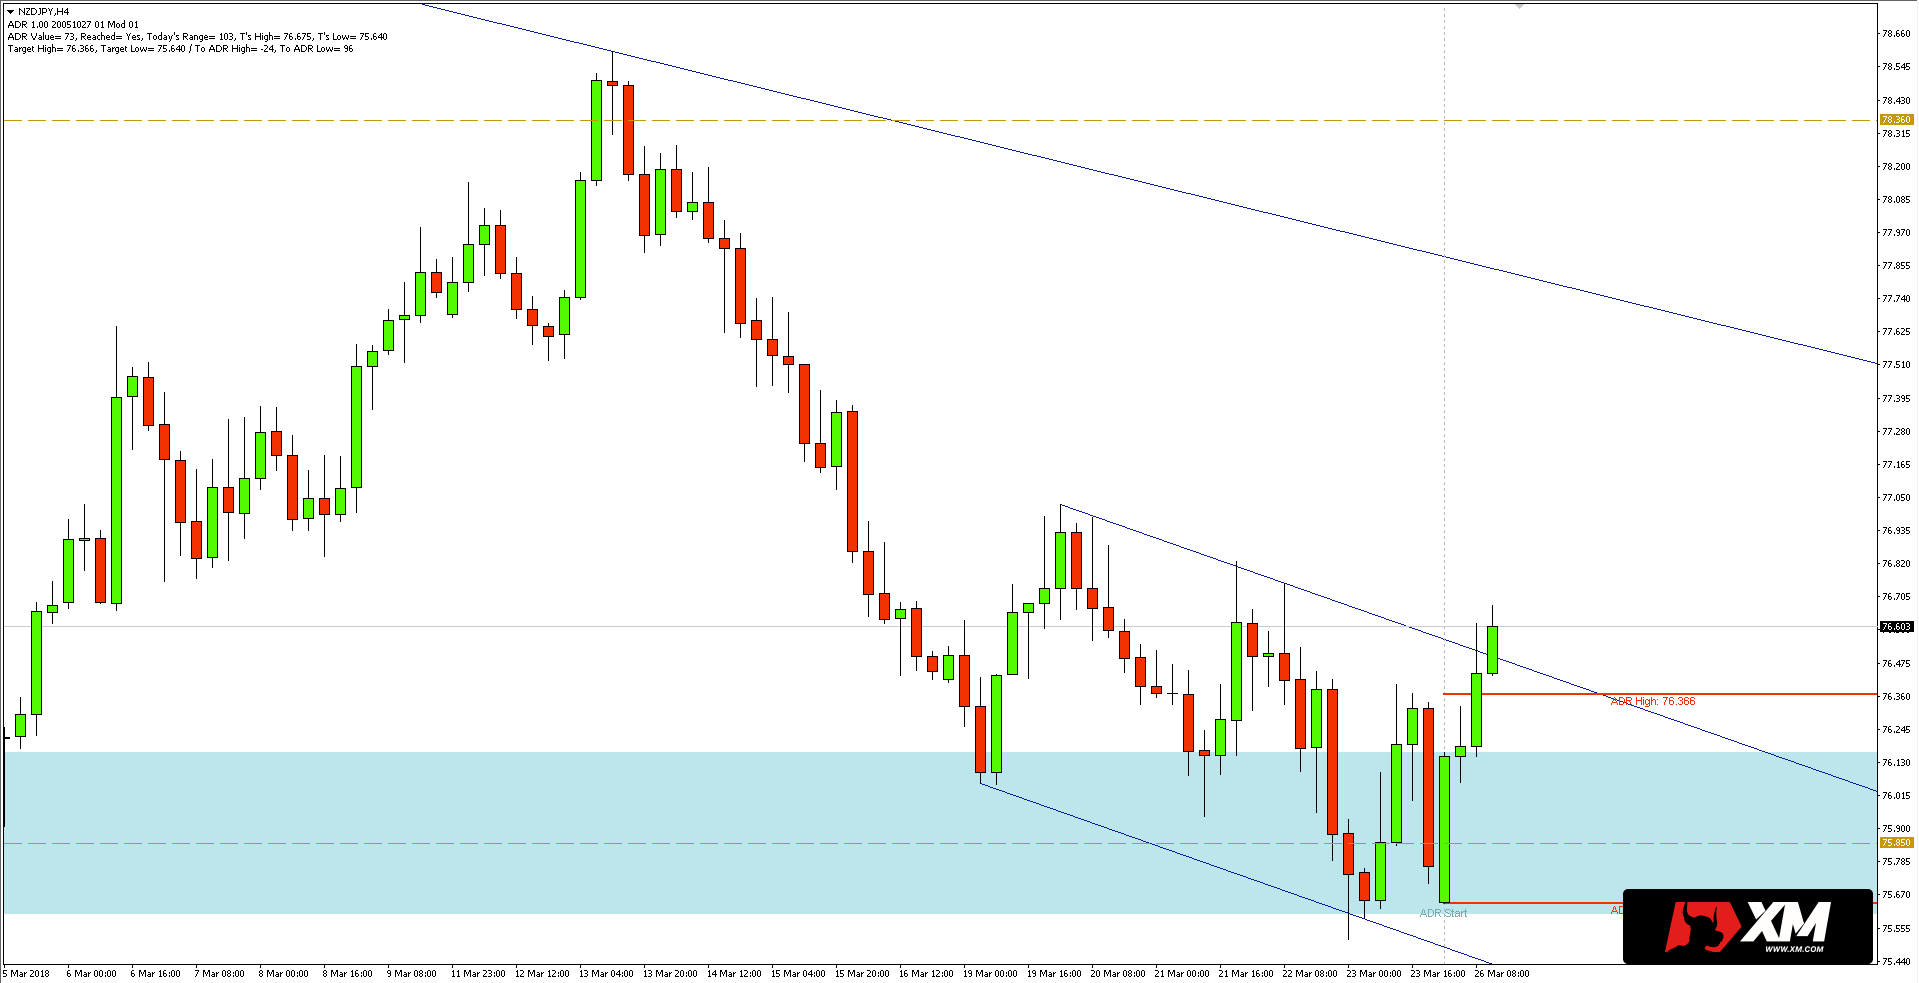
 After switching to the H4 chart, we see that the last week’s moves were in the channel, whose slope is consistent with the dominant direction. Often breaking out of such a formation in the direction opposite to its inclination is a good predictor of reversal.
Currently, pair struggles with the upper limit of the above-mentioned channel. In addition, the quotes have already completed the average range of the last 14-days, and even exceeded it by more than 20-pips.
I trade on this instrument at broker XM, which has in its offer more than 300 other assets >>
If, therefore, the resistance of the channel is successfully defeated, we may witness a deeper rebound from the long-term support at 75.85. When implementing such a scenario, the exchange rate may go further to the resistance in the form of a trend line running from this year’s highs. Another, horizontal, short-term resistance is located near 78.36.


 Review")


