“Search, Analyse, Trade” is a series of Price Action and Elliott Waves analyses. Its detailed step-by-step description can be found over here. I invite you to today’s review of selected currency pairs and potential trading opportunities. The analyses are based on the Dukascopy sentiment that you can get here.
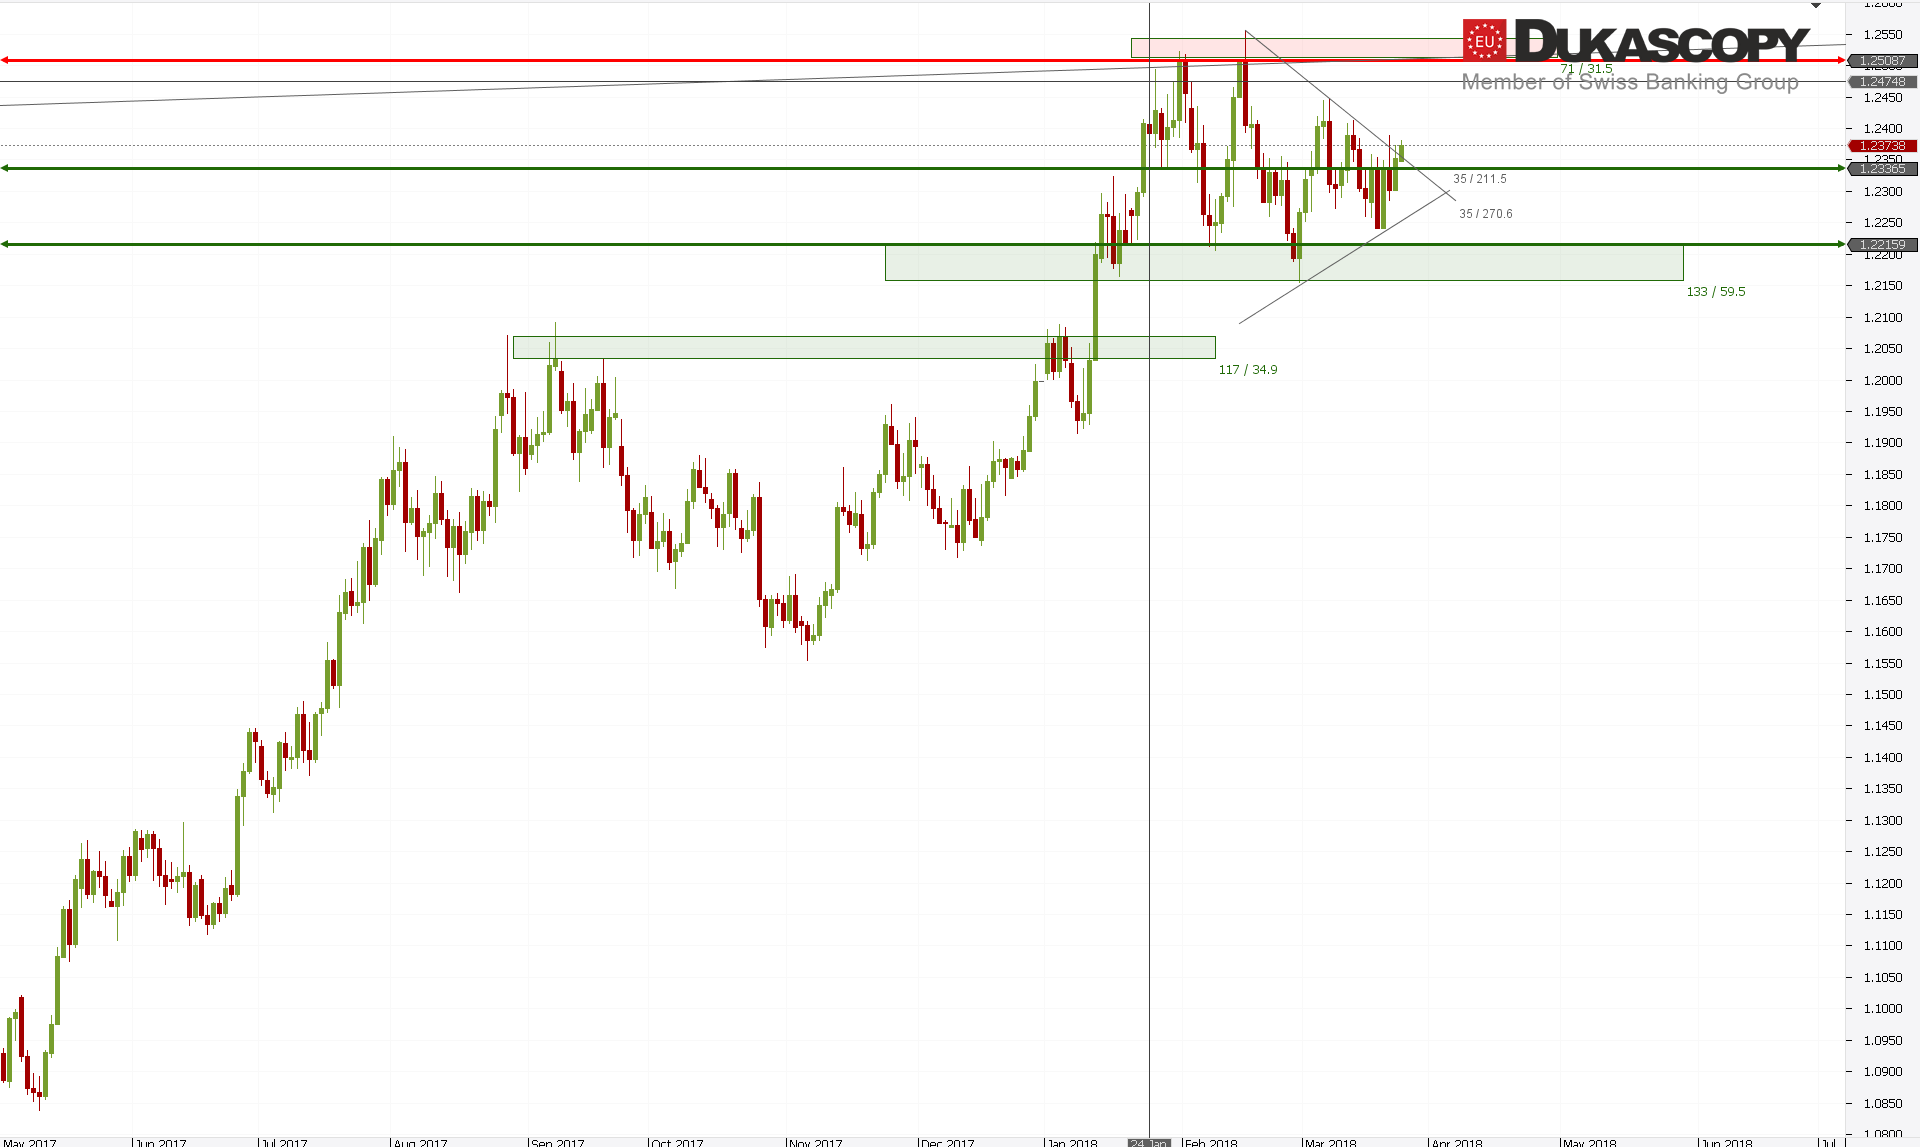 EUR/USD pair from yesterday is trying to break the upper limit of the consolidation zone, which resembles a triangle. If the pair manages to overcome the resistance, the way to higher levels will be opened. It’s hard to say if the possible increase will be a wave 3 counting from the last low, or the wave C of the wave B of the larger corrective structure. This probably will be cleared only after the attack on the level of 1.2410 where there is another obstacle to the movement towards the high.
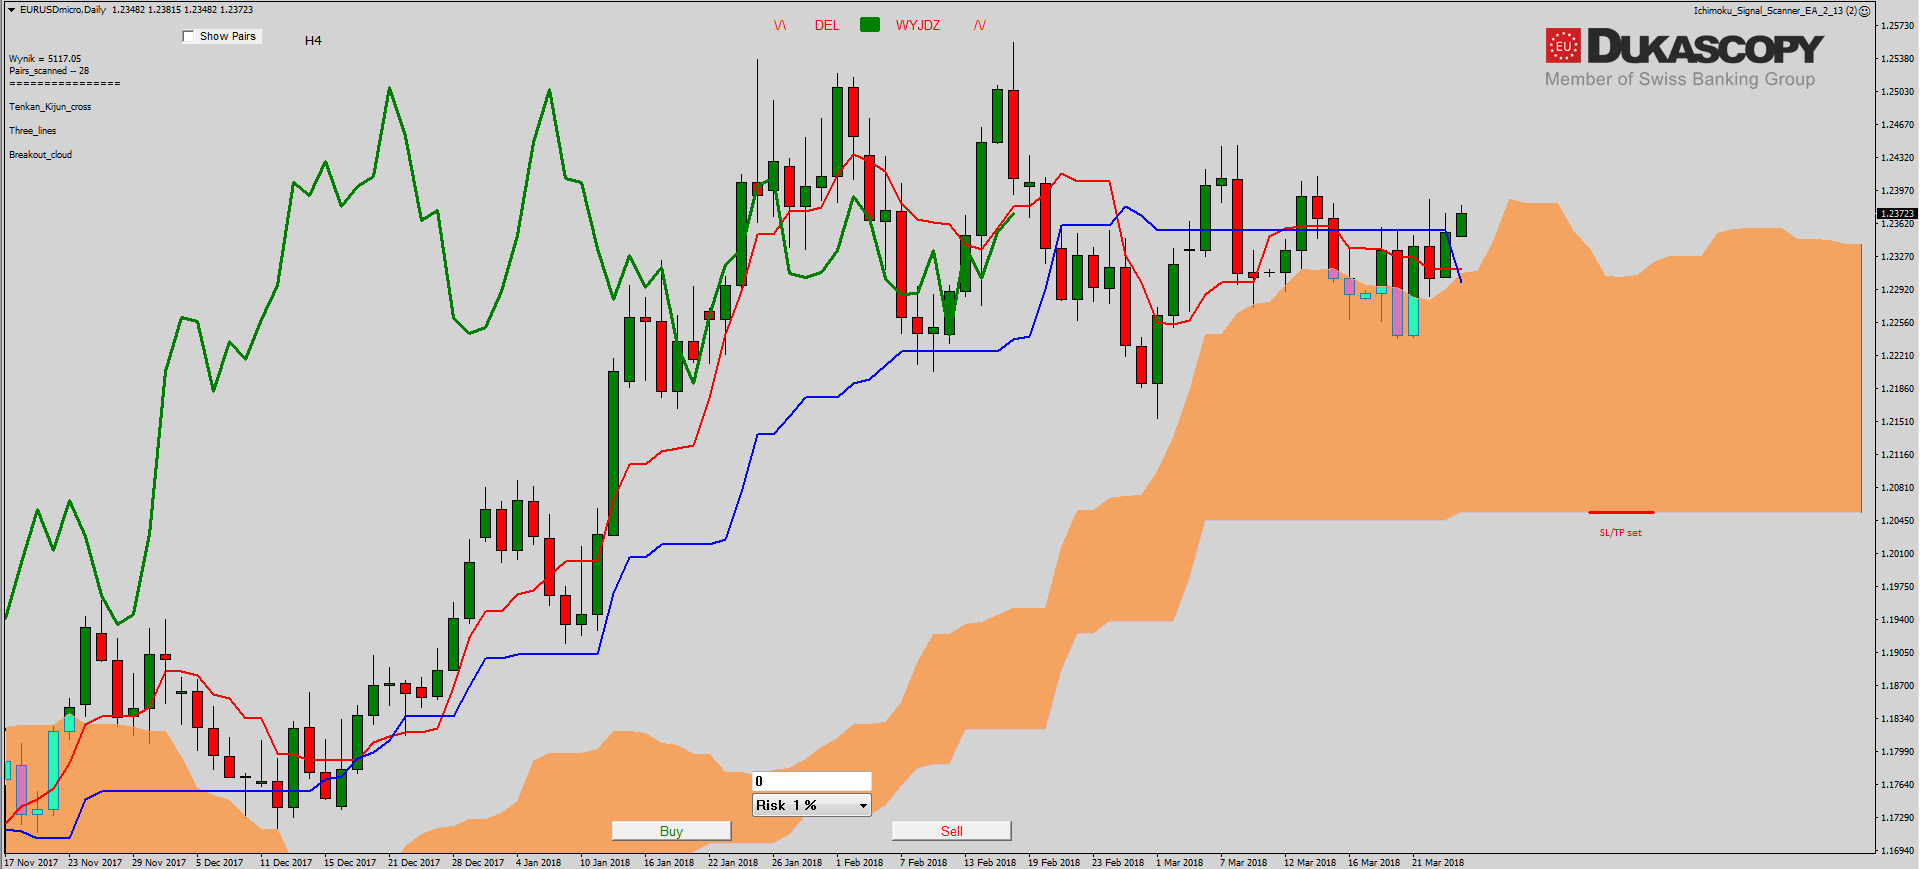
On the Ichimoku chart without major changes. The pair is currently testing the Kijun line and if it manage to end the day over it, then the move towards the summit will be possible. Tenkan’s line has reached Senkou Span A and it may be possible to find support there. Chikou still remains within the corrective structure and is currently testing Tenkan.
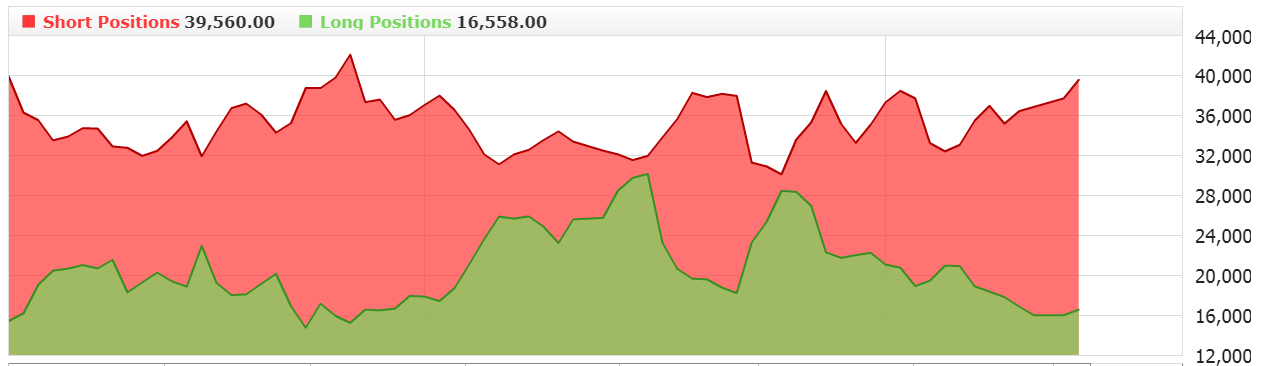
The sentiment is more and more bearish. From Friday, we see a strong increase in short positions with a simultaneous reduction of long ones. This is a very good layout for potential increases, because such a big advantage on the short side should drive increases.
The partner of “Search, Analyse, Trade” series is a Dukascopy Europe broker who gives its customers access to ECN accounts in different currencies.
Trade on Forex, indices and commodities thanks to Swiss FX & CFD Marketplace. Open free trading account right now.
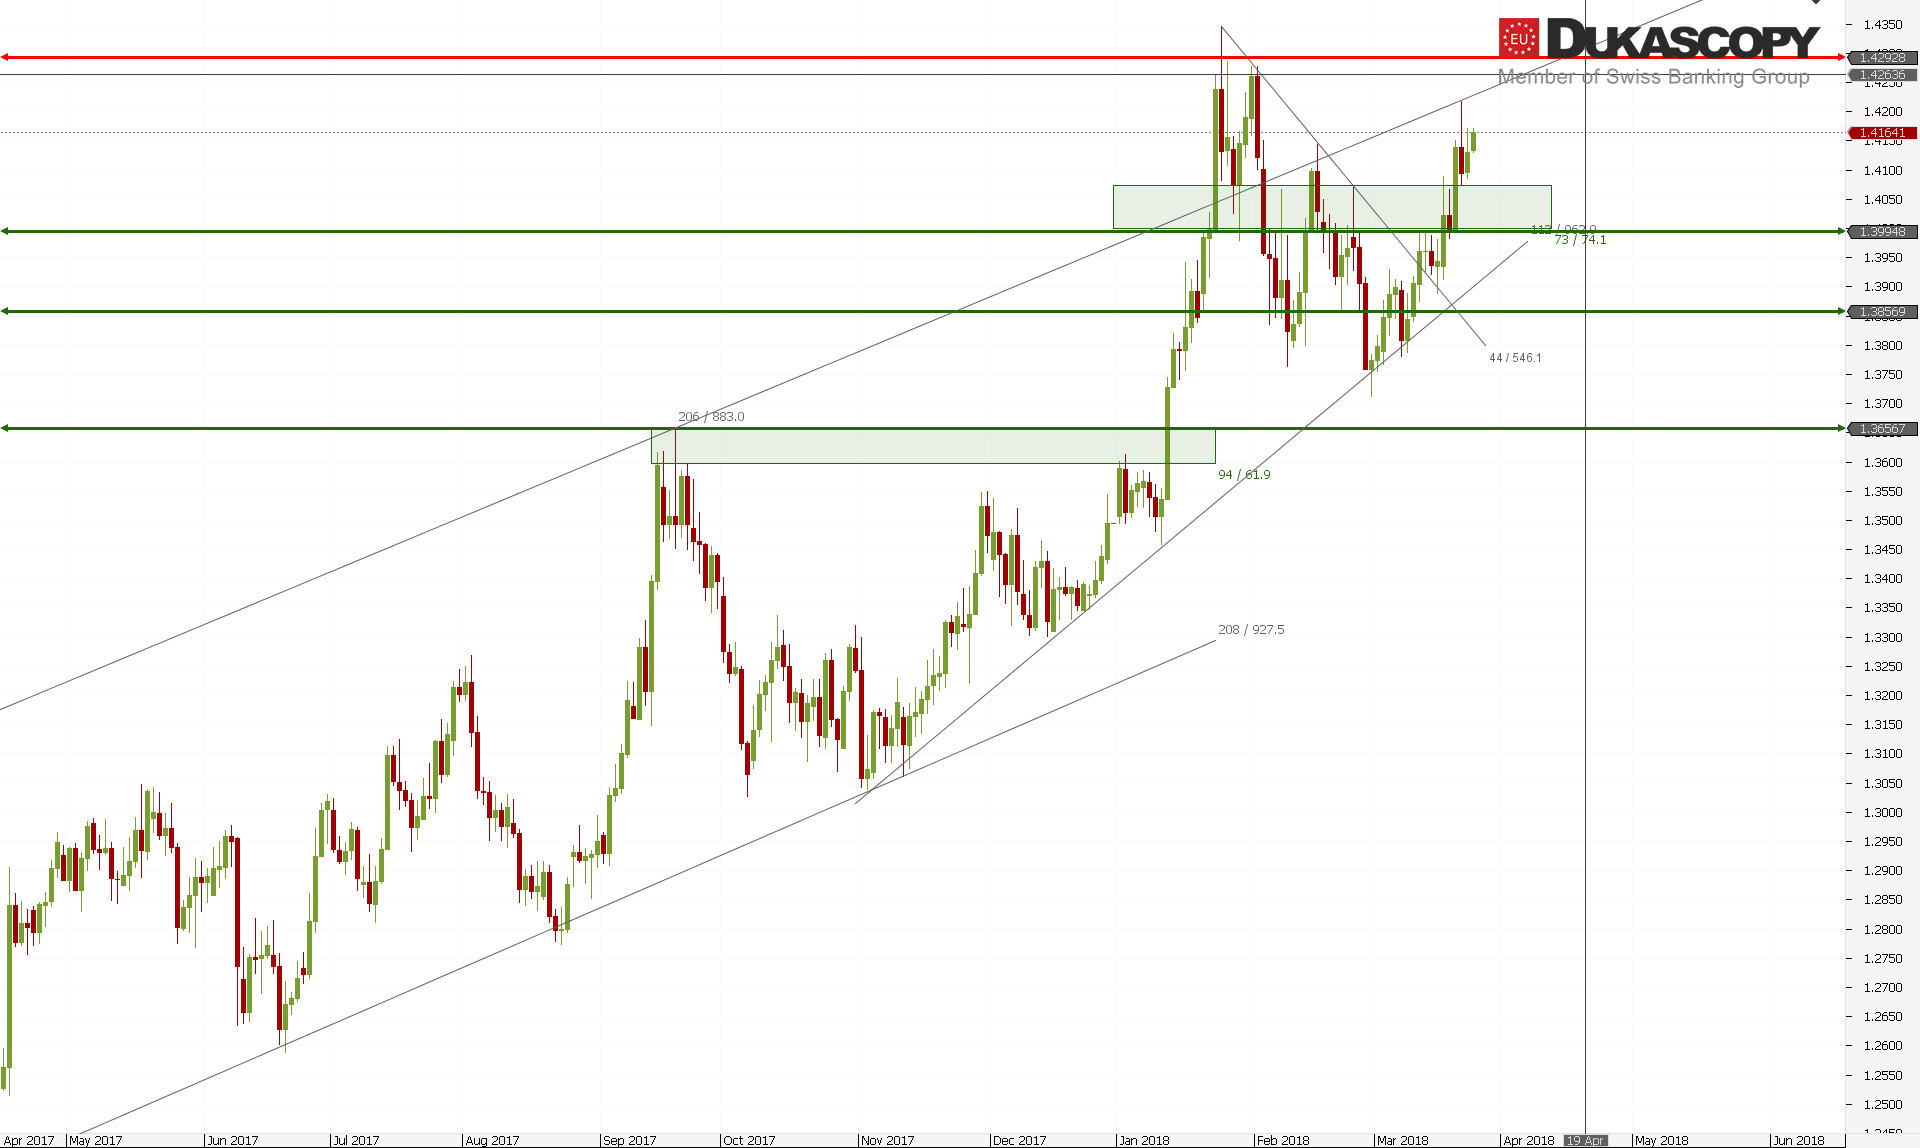 GBP/USD after strong rejection of the resistance zone, reached the upper limit of the demand zone and from this moment we watch the attempt to negate the rejecting candle. The pair is currently moving inside Inside Bar and breaking it out should show the direction in which the pair will move in the near future. Breaking the top is the continuation of the third wave and the probable test of the key resistance zone. Breaking the bottom can be beginning of construction of a wave of the fourth last growth sequence.
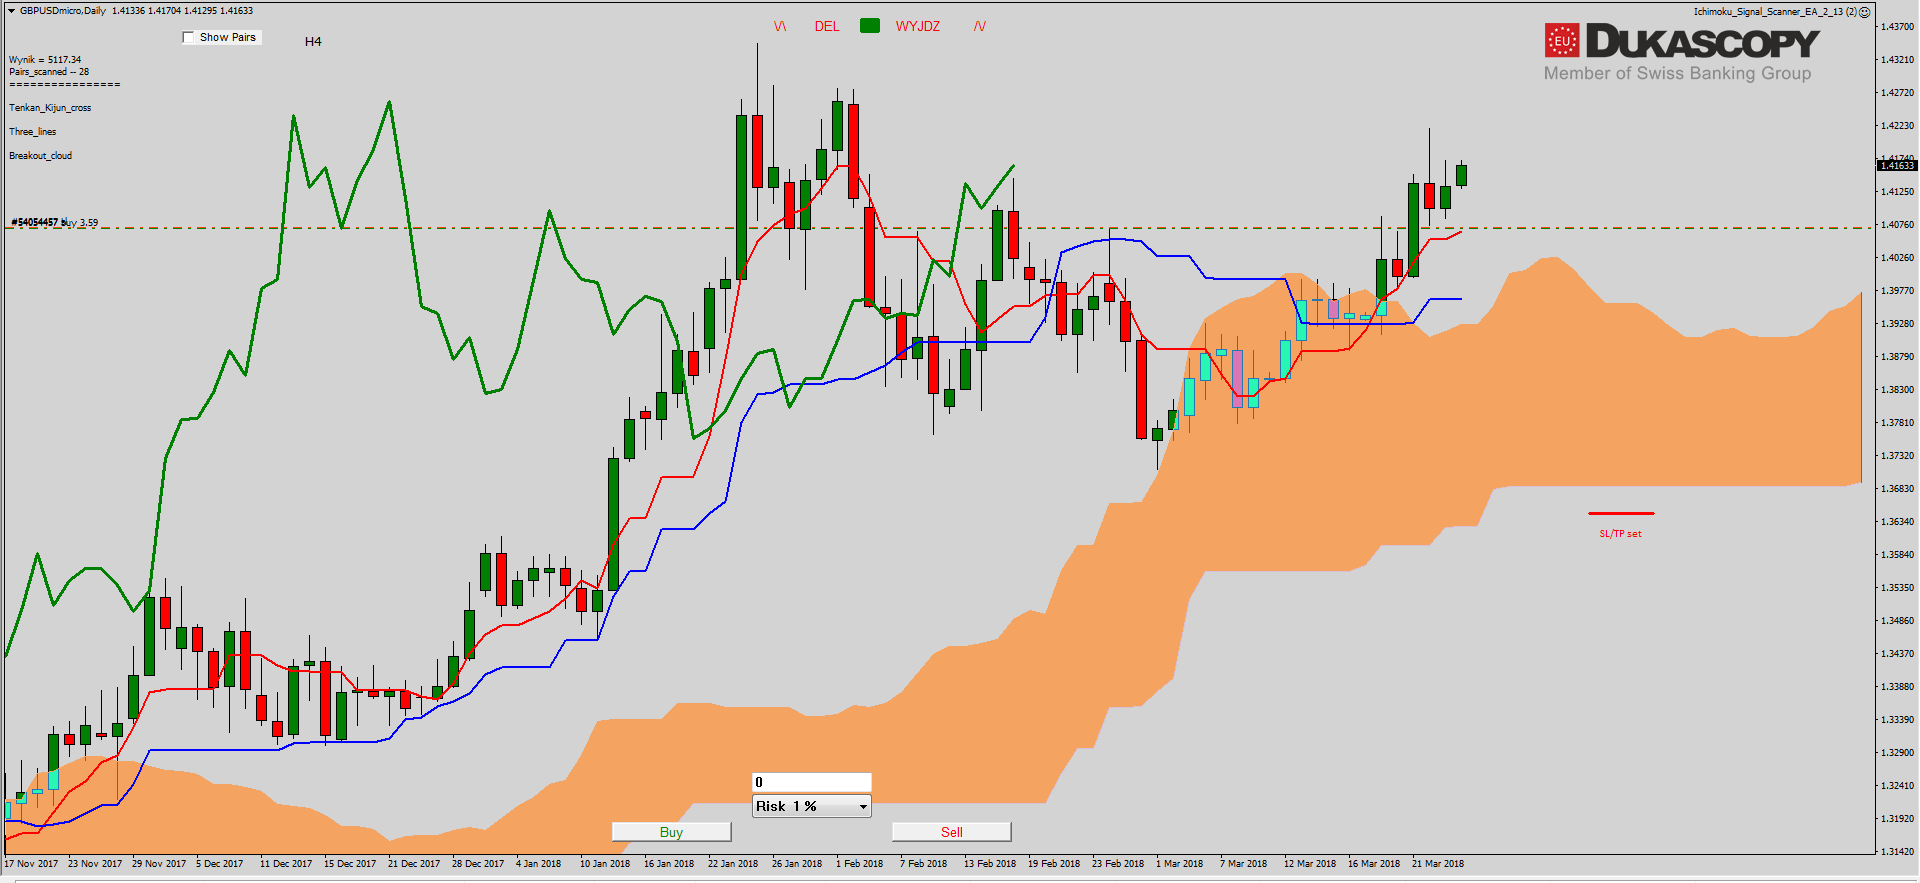 On the Ichimoku chart, we see that after two buy signals, i.e. a cross inside the cloud and breaking out of it, the pair continues to grow. A few days ago, the pair again tested the Tenkan line from the top which was a very good opportunity to buy on the lower TF. The Tenkan line confirms the increases, while Kijun remains flat and the price slowly moves away from it which may lead to a re-test. Chikou managed to get over the price and confirm the increases, which is not done by sentiment.
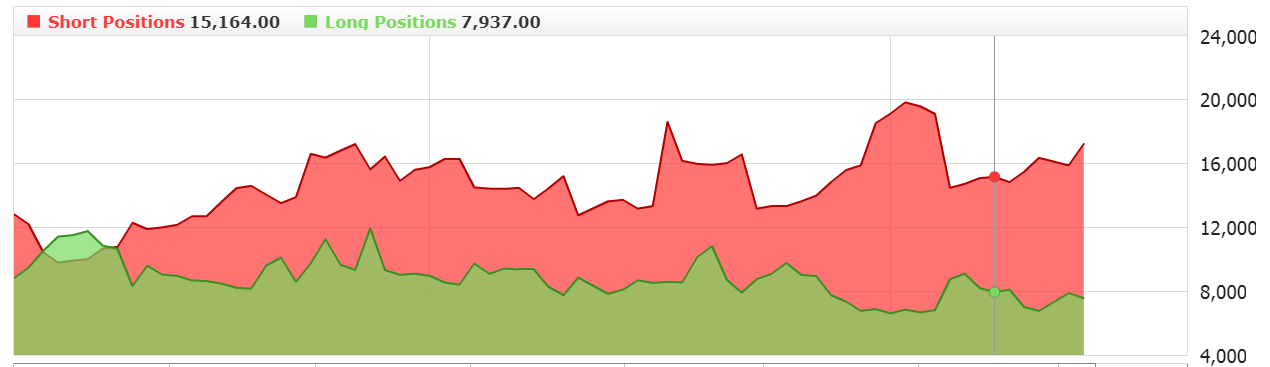 From Friday, we have increase in short positions. Apparently, the small players still do not believe in overcoming the key resistance zone and position themselves to reject it.


 Review")


