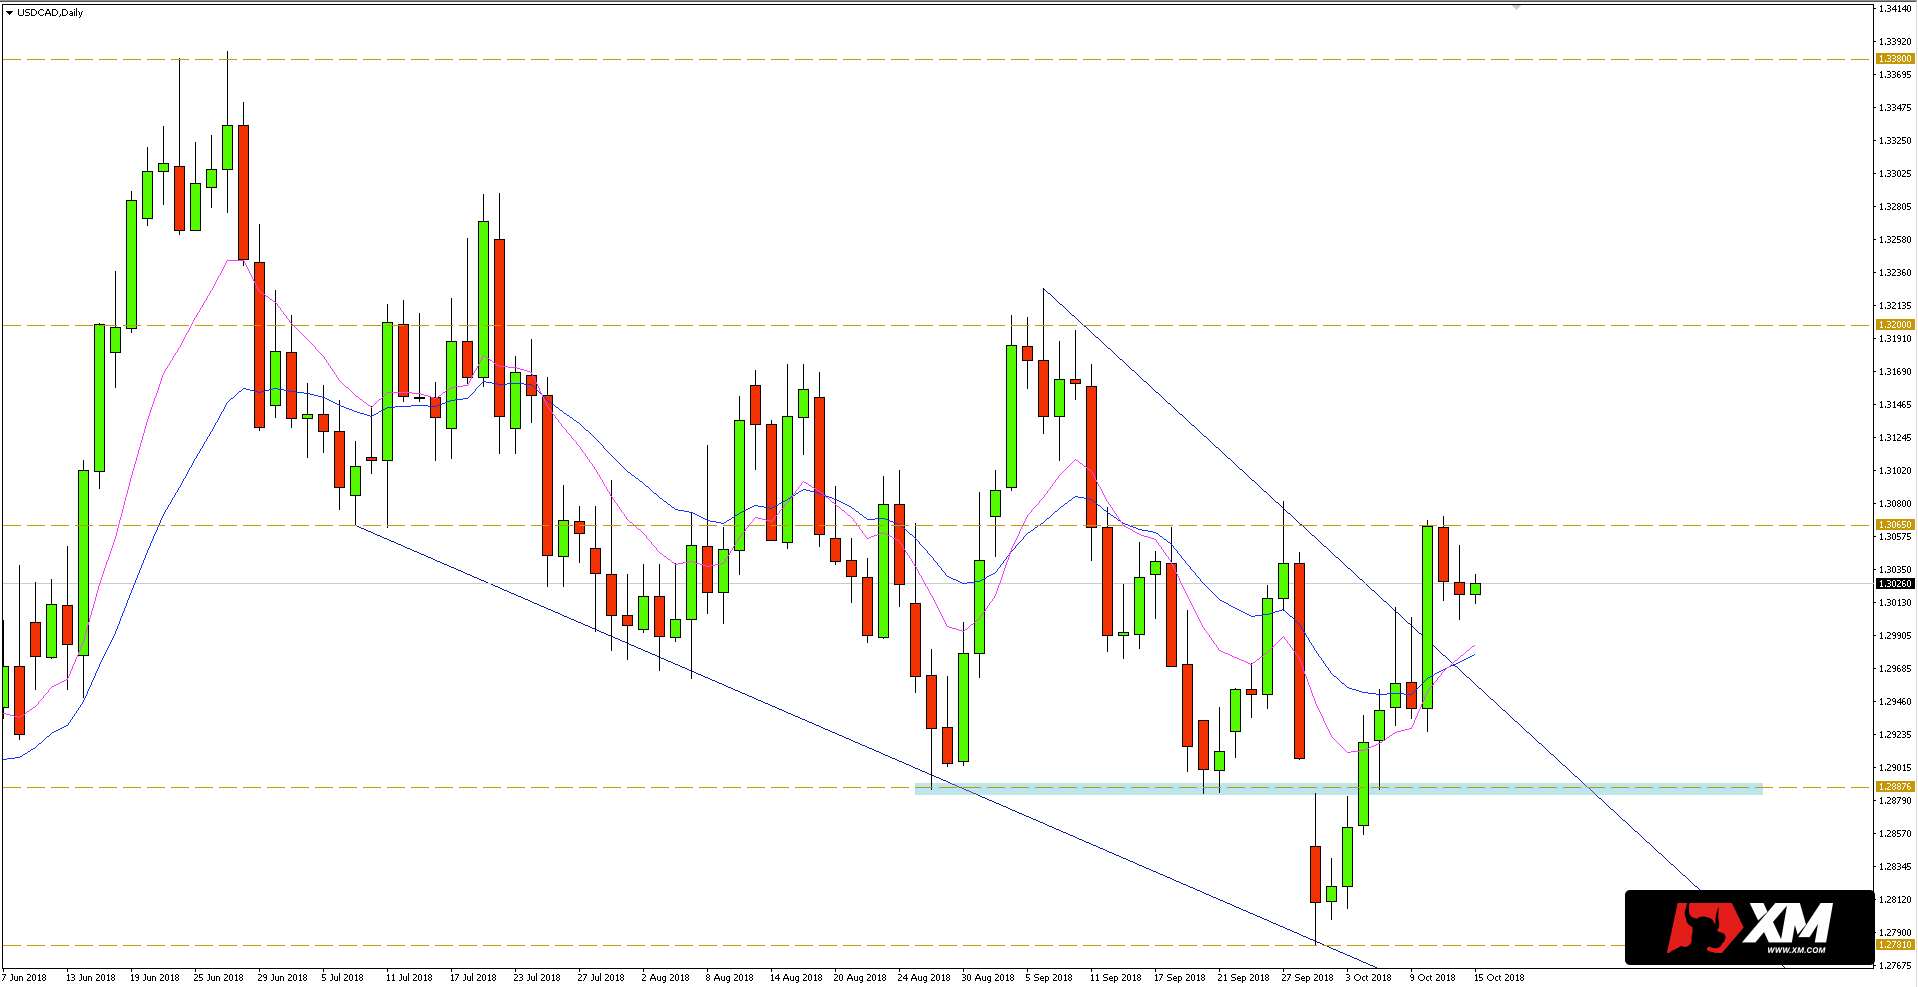
During the past week, the bulls on the USDCAD currency pair had made significant progress. As it can be seen on the daily chart below, during the Monday and Tuesday sessions bearish pinbars appeared testing the downward trend lines running from the September highs.
It could be expected that the rate will continue the downward movement after the aforementioned price action formations. It turned out, however, that on Wednesday the bulls dominated the market and the previous pin bars were negated and the course reached the horizontal resistance at 1.3065.
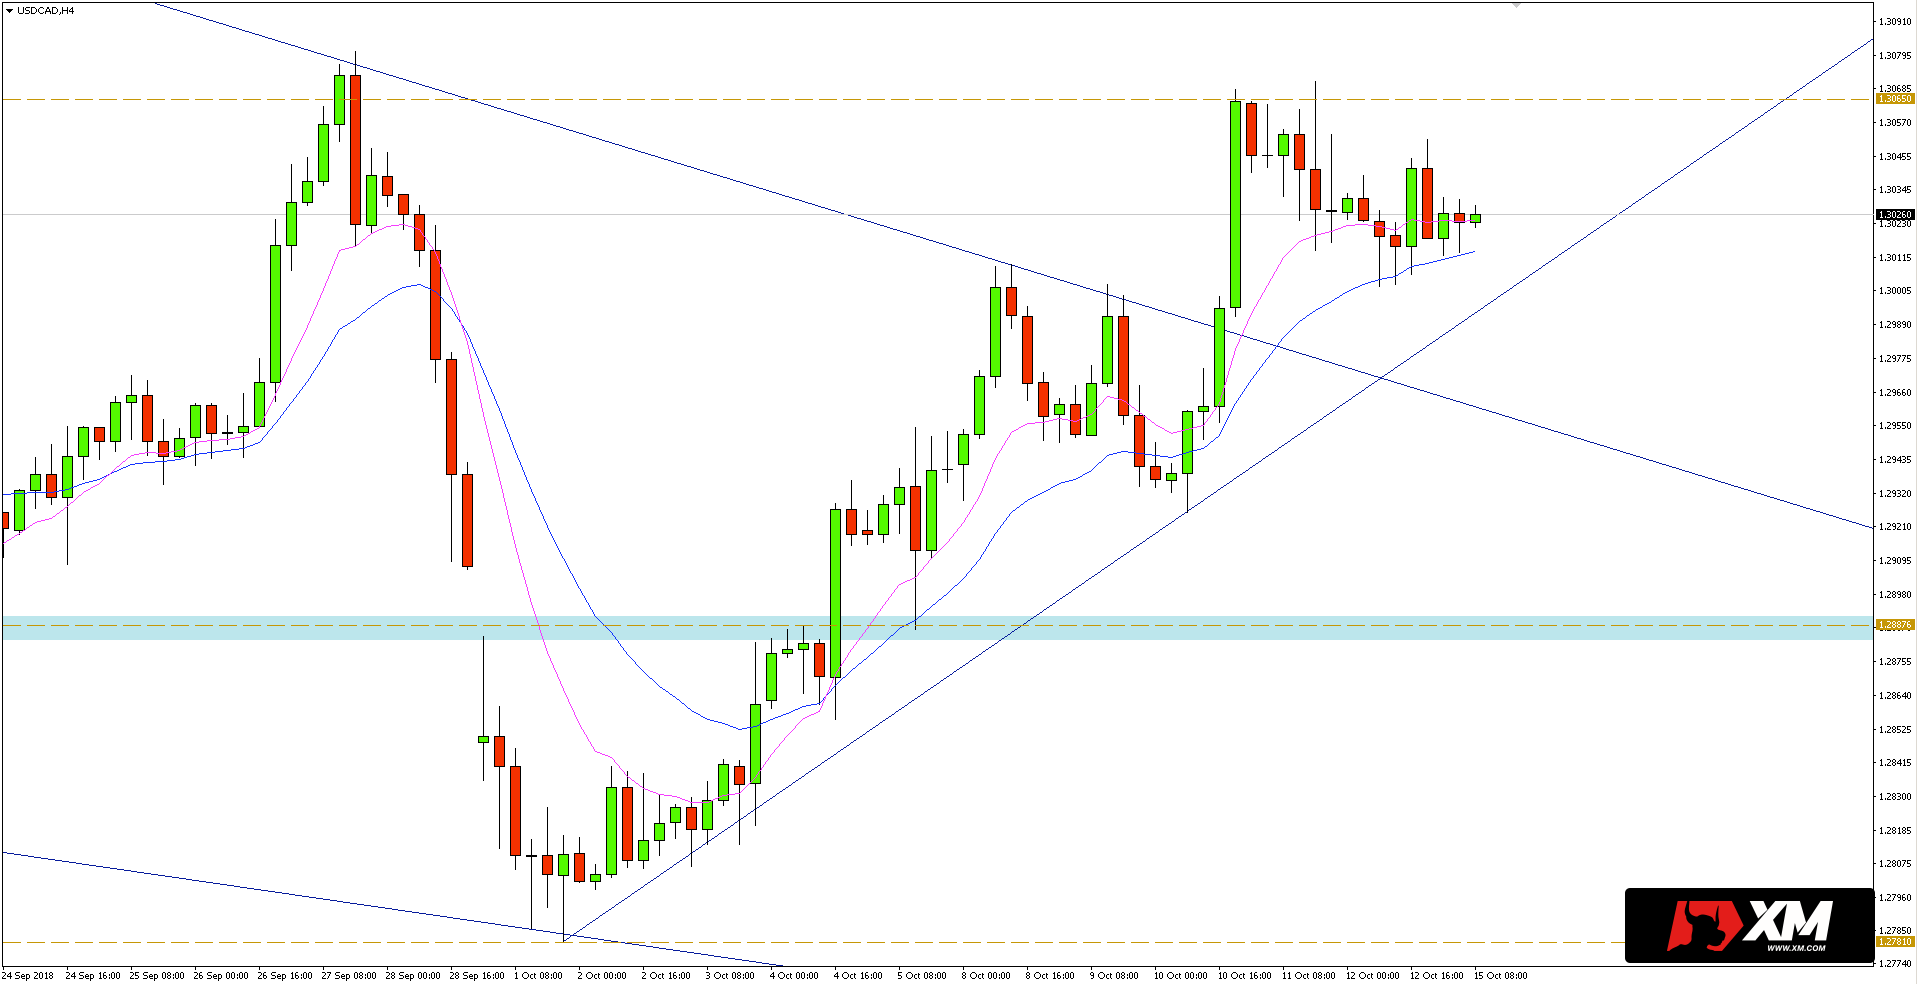
 The 4-hour chart below shows a positive resistance test at 1.3065, which is a correction of the Wednesday’s impulse. The price so far remains above the channel EMA 10/20, and is also close to the trend line from the minimum of the current month, which indicates the short-term advantage of the demand side.
I trade on this instrument at broker XM, which has in its offer more than 300 other assets >>
If the support areas created by the trend line and the medium channel can withstand during the test, the course after successful breaking 1.3065 can continue the upward movement. The nearest key resistance in such a scenario is around the round level of 1.3200.


 Review")


