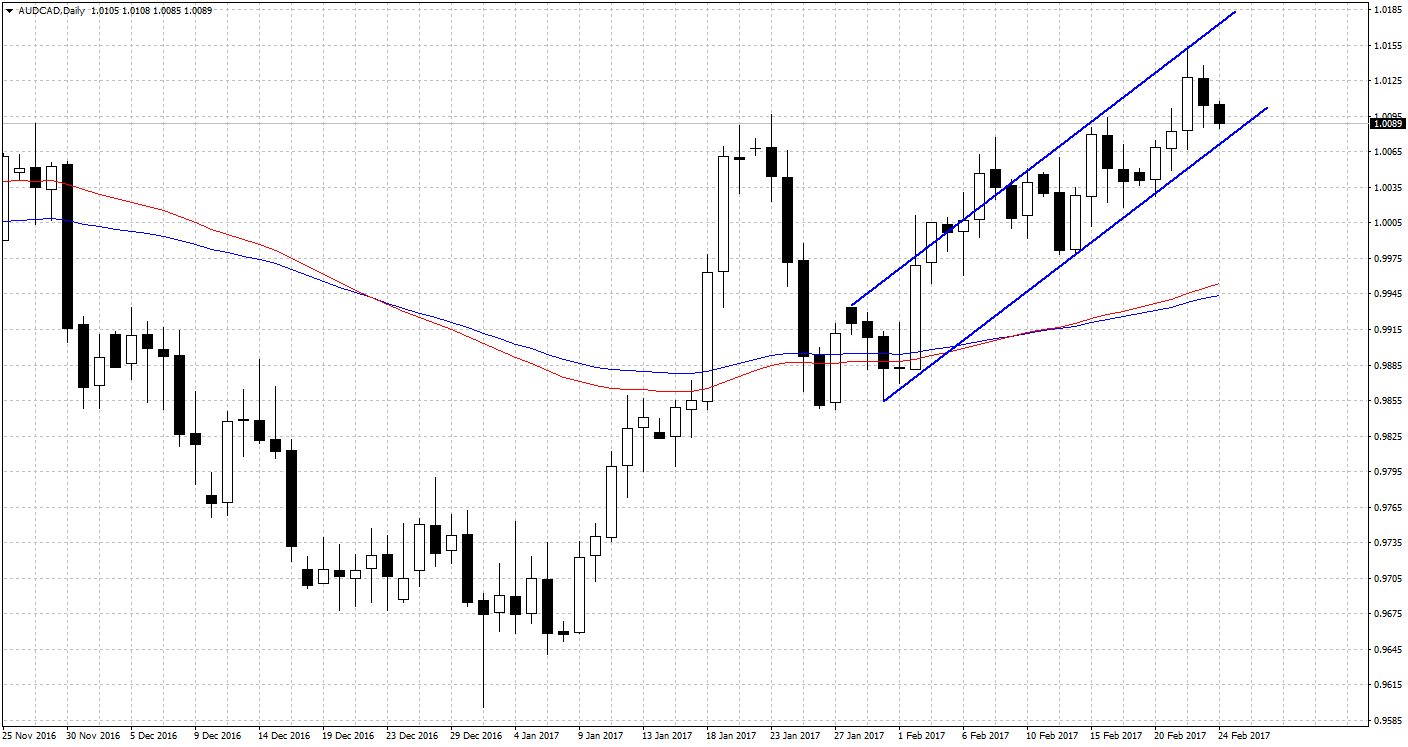
On daily chart can be observed upward trend. Price initially led to a strong impulse, then after correction formed upward channel. Currently we can notice that after setting a new higher high price is correcting the impulse and is close to the bottom of the formation. It is worth to view lower time frame.
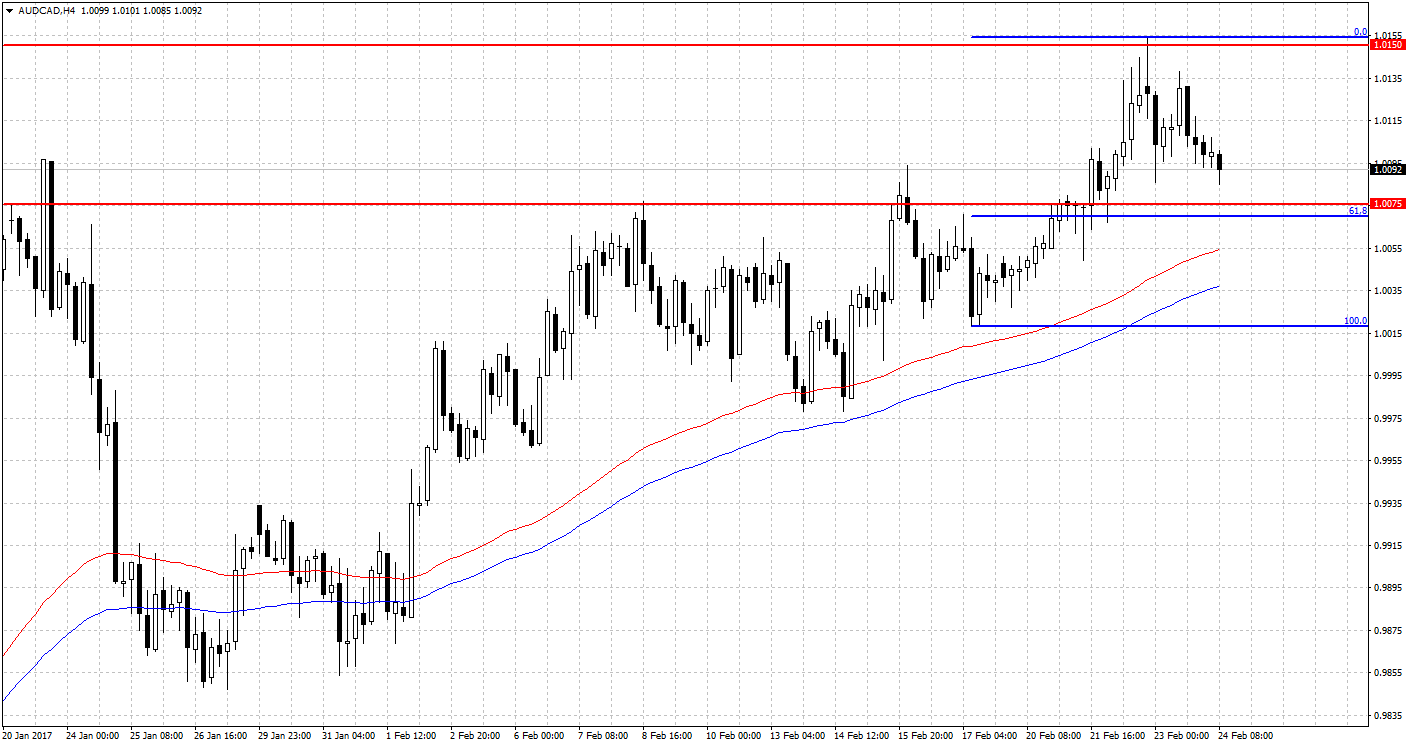
AUD/CAD on H4 chart approach to test the support level at 1.0075. This level coincides with the 61.8% FIBO abolition (measured from the low of 02.17.2017 r.) and a growing band of averages EMA (75-, 100-periodic). Probably test of these areas will be characterized by increased reaction of the demand side. Resistance is located in the vicinity of the last high at the level of 1.0150.


 Review")


