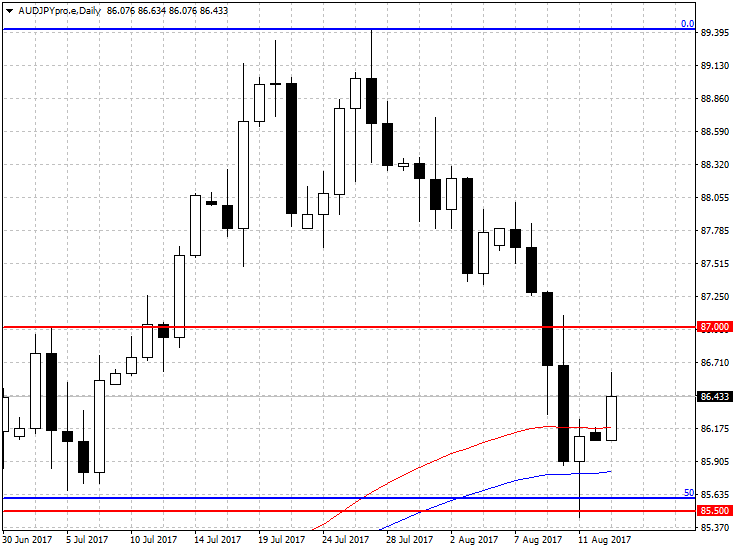
On AUDJPY daily chart you can see dynamic declines and breaking down of level 87.00. We can notice that support area, at a round level 85.50, coincided with 50% of the FIBO abolition and ascending band of average EMA (75-, 100-period). Test of the zone led to stronger reaction of demand side and a hammer formation was set. Currently there is growing pressure of buyers. It is worth looking at a chart with lower time interval.
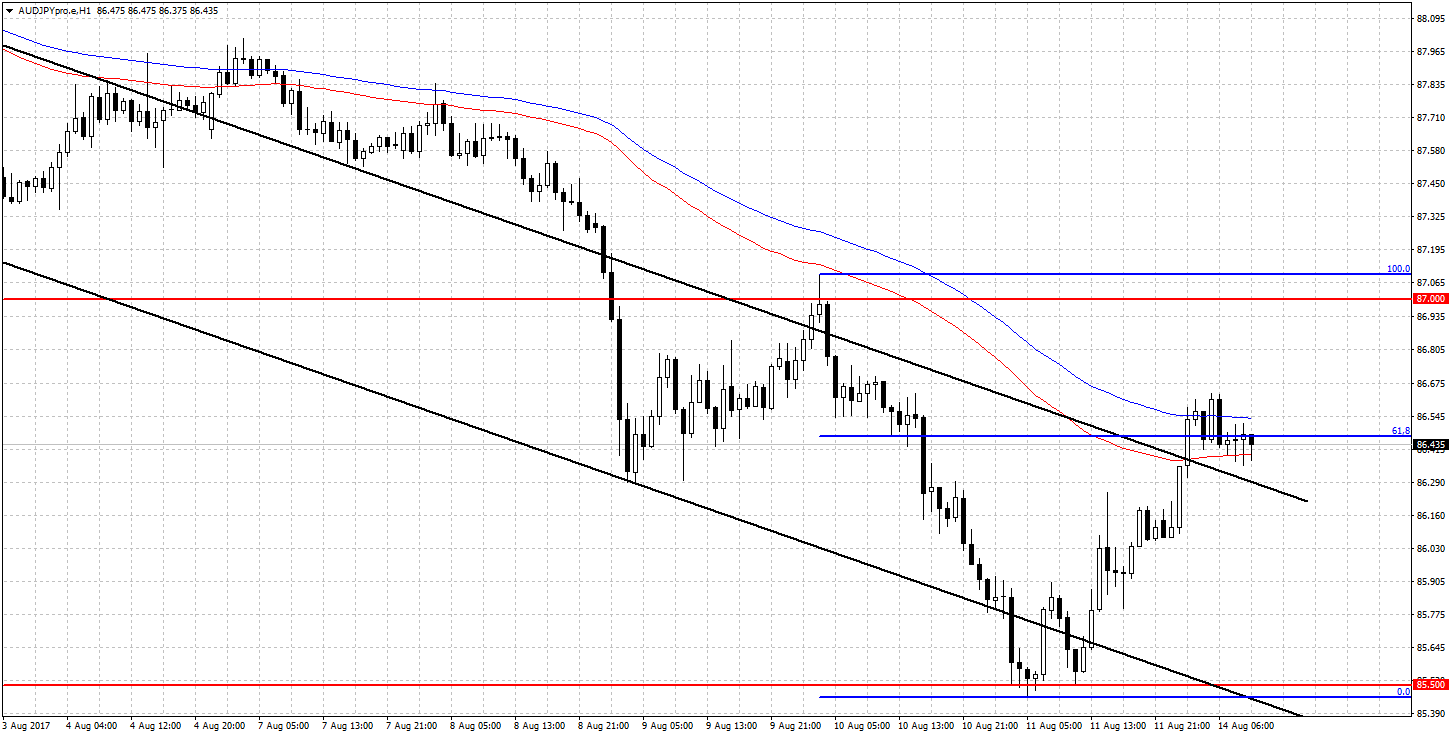
On H1 interval, you can see correction of recent declines. Price have tested 61.8% of the FIBO abolition, the upper limit of bearish channel, which overlaps with band of averages and round level 86.50. Increasing supply pressure and return to the channel will likely lead to further price declines. Support is at a round level 85.50. Breaking it will open the way to further falls.


 Review")


