Price Action Pattern
Double Top pattern could be seen often at many time-frames. Sometimes it took very spectacular form when trend lasting many years start to reverse. This pattern is supported by few different elements of technical analysis. Obvious strengthening for that pattern is a resistance zone.
When price form new high and rebound, that area becomes a new resistance. Such pattern is a counter-trend formation and requires skilful play. The danger of that pattern is a high probability that a potential double top evolve into a regular resistance which price may simply break.
Below there are two trading ideas for that formation:
1) Add an additional element of technical analysis to confirm correct spot for position opening.
2) Open the short position by putting SELL STOP order a few pips below candle which forms double top pattern.
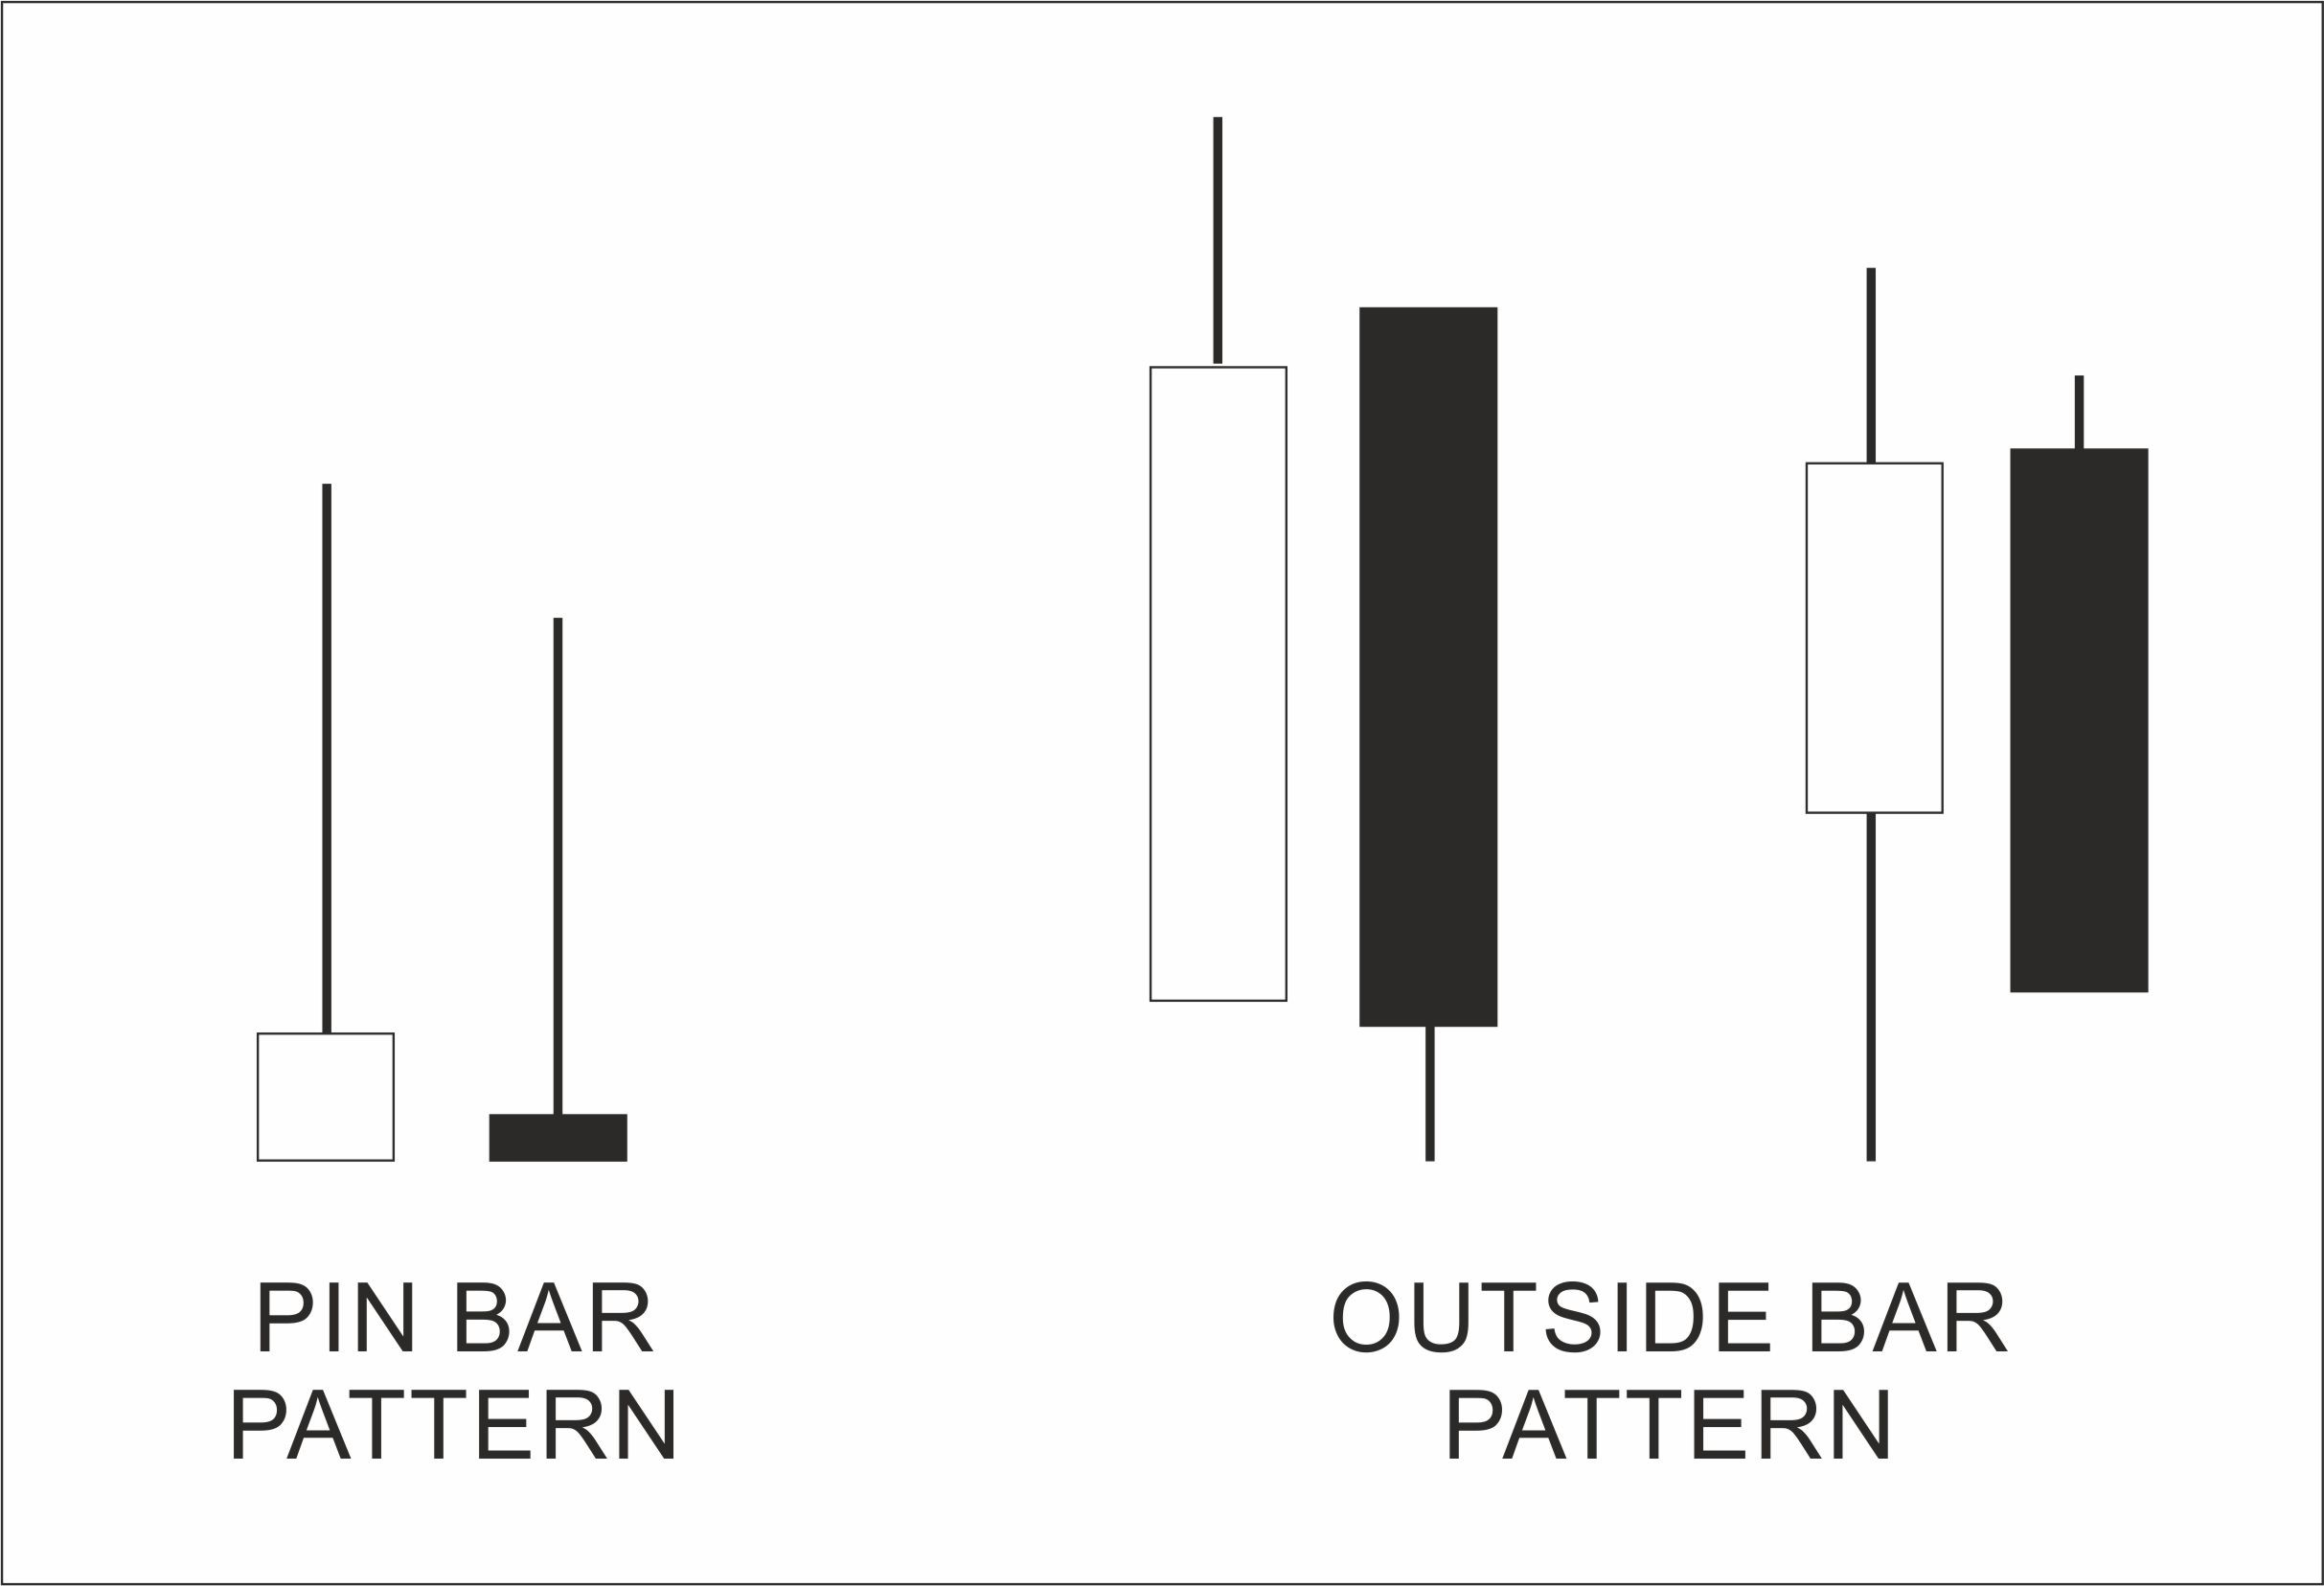
In first case – additional element of technical analysis – it could be price action pattern known as “reversal candle”. The most effective and often used are OUTSIDE BAR pattern and PIN BAR candle. When price reach the area of double top we should open the trade when one of the below pattern show up:
In the second case we active SELL LIMIT order below closed candle, which form double top pattern. It confirms that position will be open when price starts to fall. However there will be a lot of transaction ending with Stop Loss, but one transaction when trend actually reverses could be very profitable.
Examples of double top pattern at various time-frames:
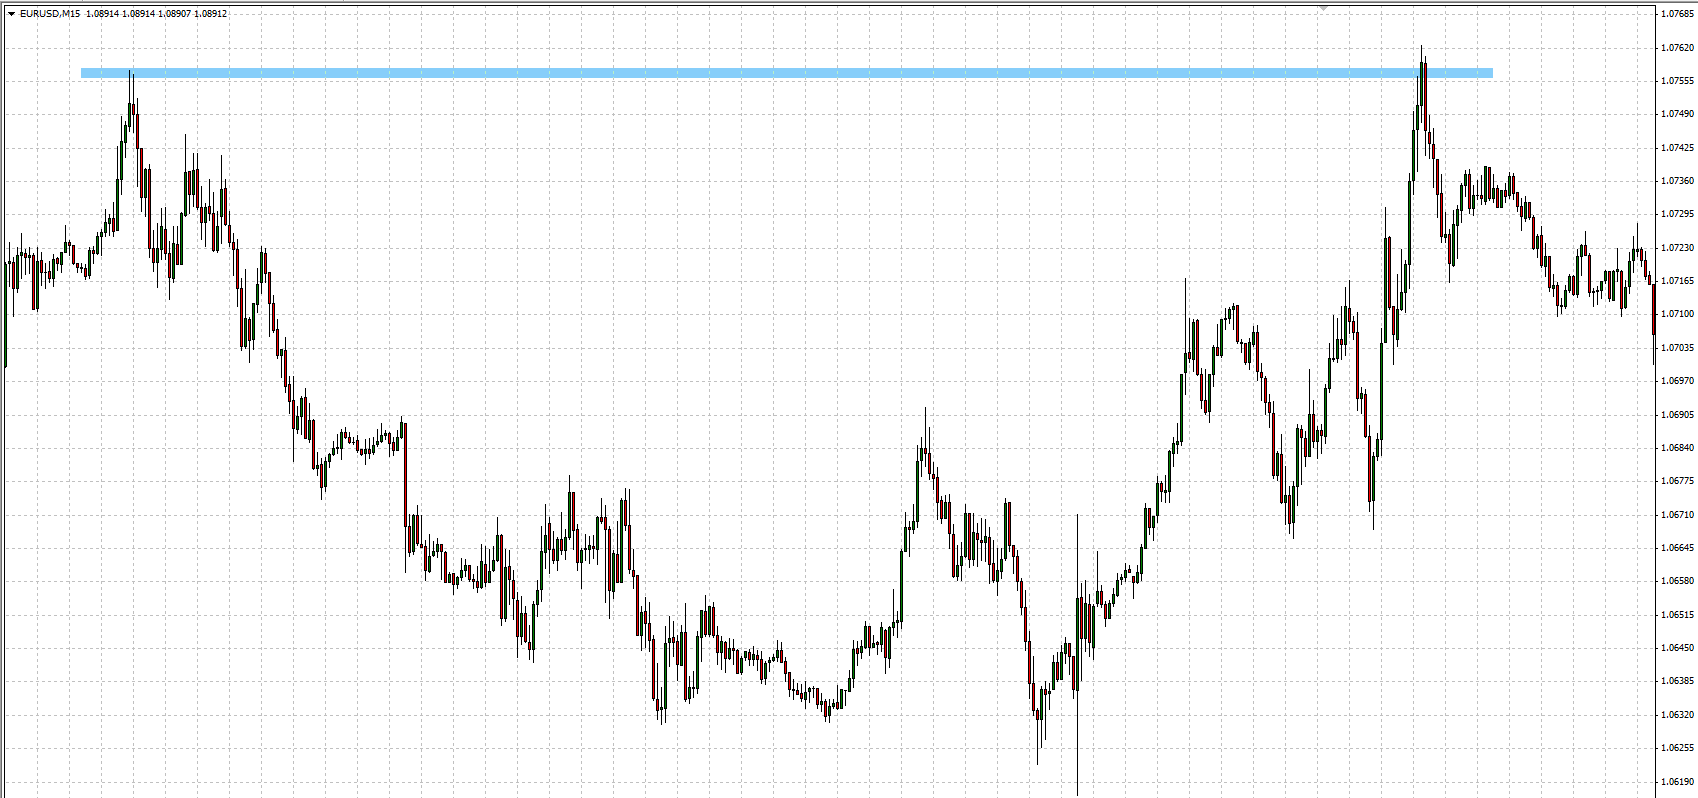
EURUSD, time-frame M15
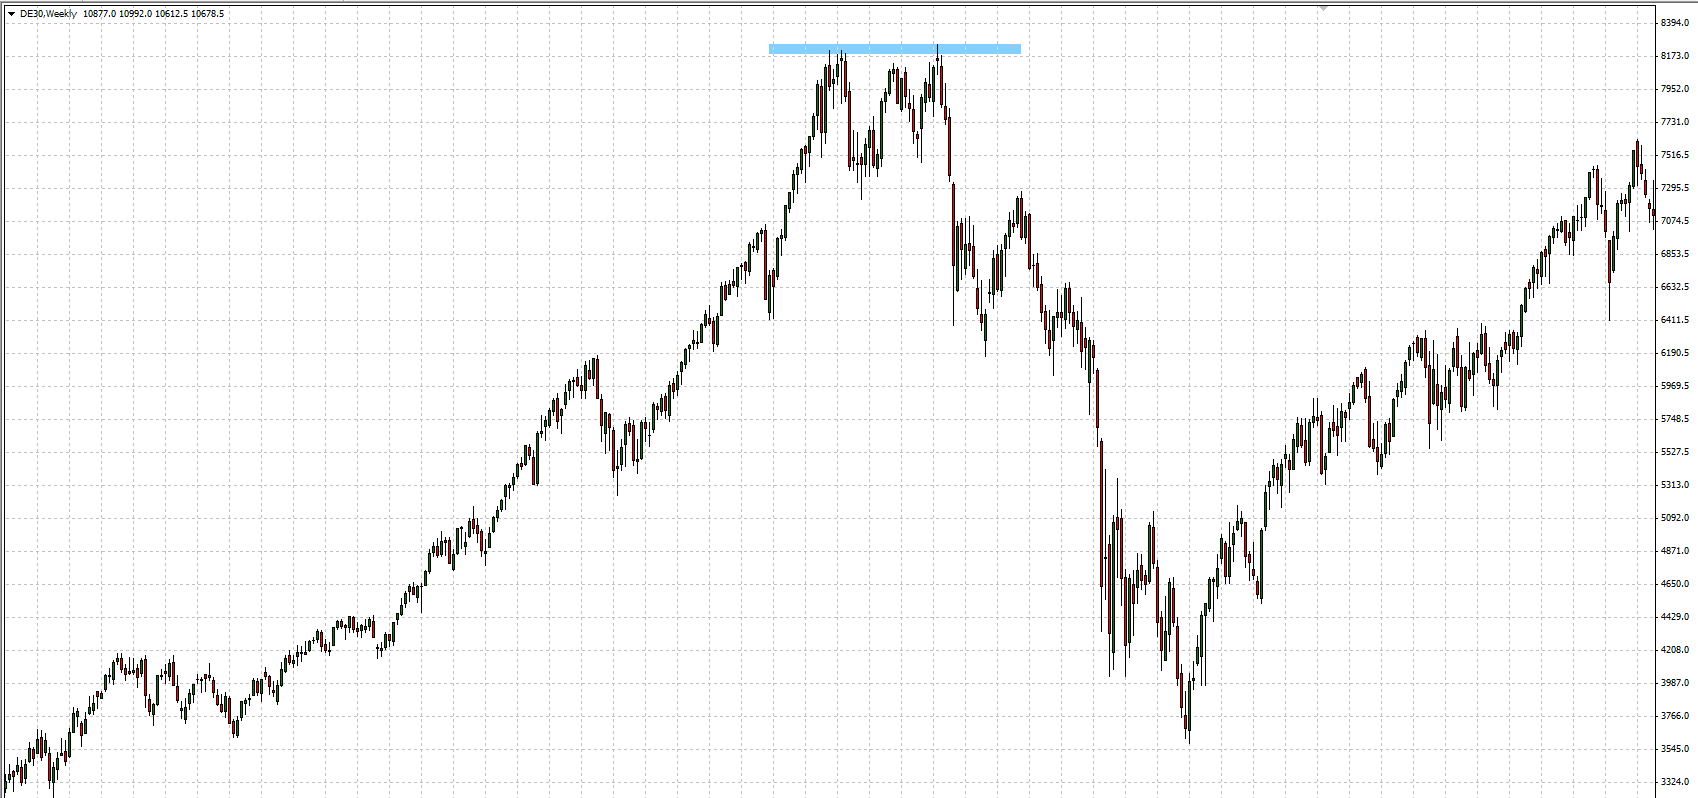
DAX30, time-frame W1


 Review")


