When the AUDUSD pair set the maximum of this year at 0.8010 at the end of February, it seemed that the uptrend would continue and the price would move towards the 2017 maximums.
- price leaves the downward channel
- downward breakout from the inside bar
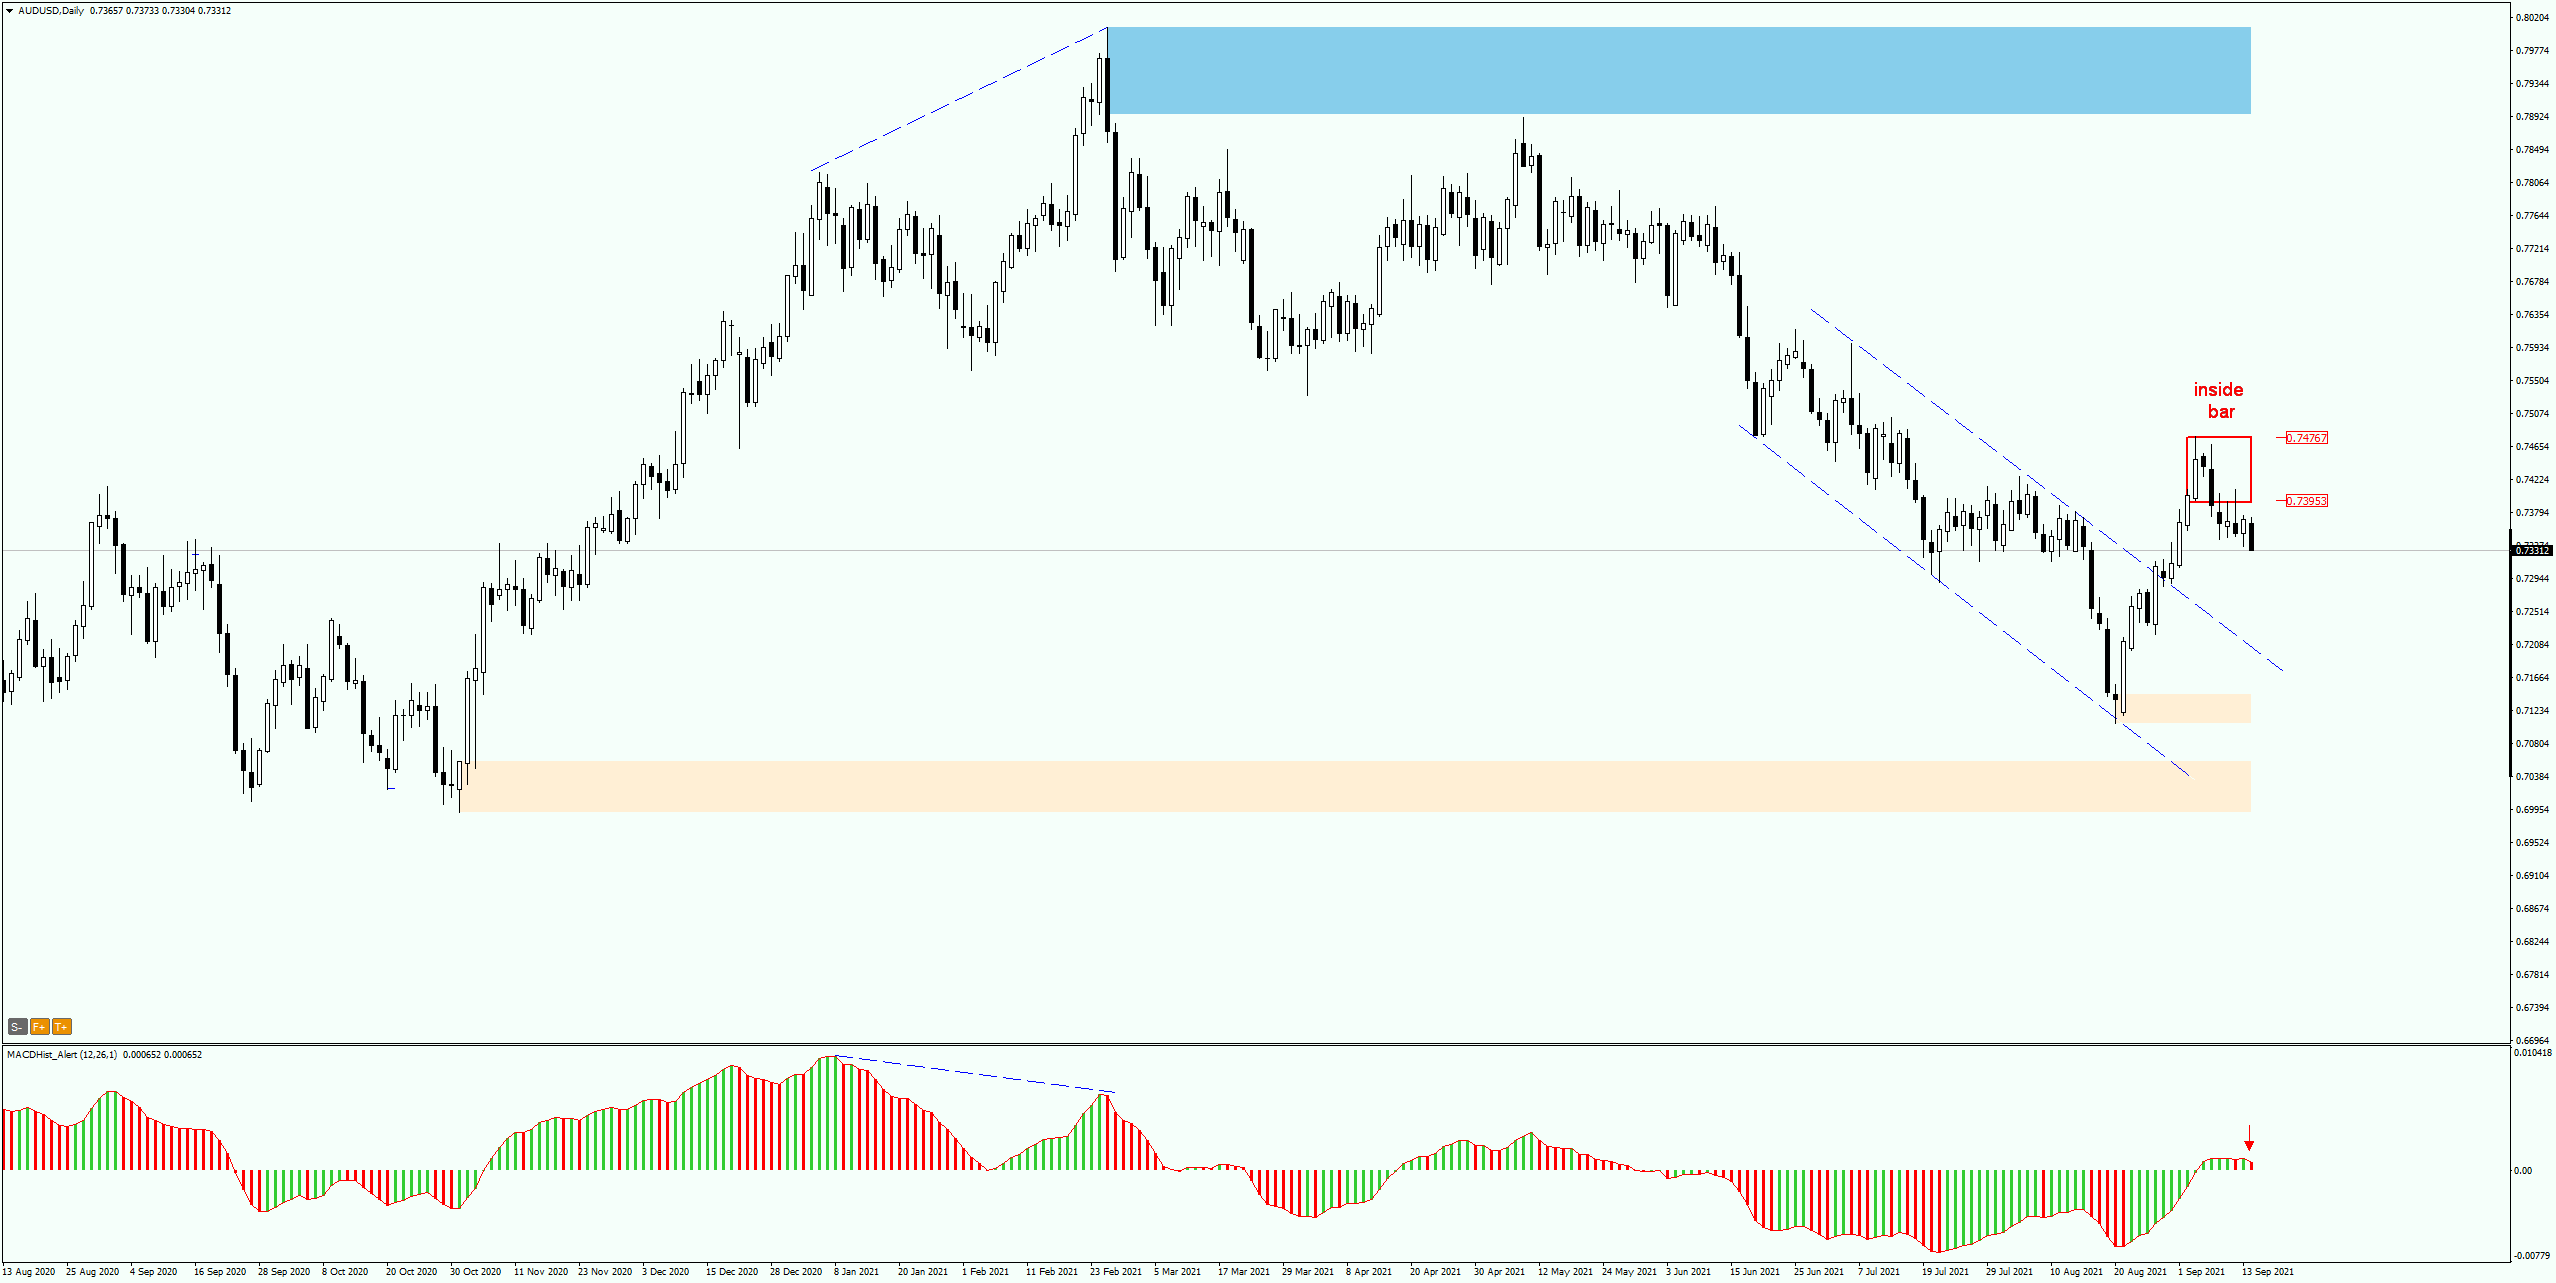
However, the opposite happened. On the daily chart, a bearish engulfing pattern appeared and the price started to fall. Since mid-June, the decline gained momentum and the downtrend formed a downward channel with a 230p range.
At the end of August the price broke out of the channel upwards, but already on 3 September an inside bar formation appeared, and two days later the price broke downwards. Today’s daily candle caused a maximum to appear on the MACD and the oscillator entered a downward phase. If the day ends with a declining MACD – it may be a signal for a continuation of declines.
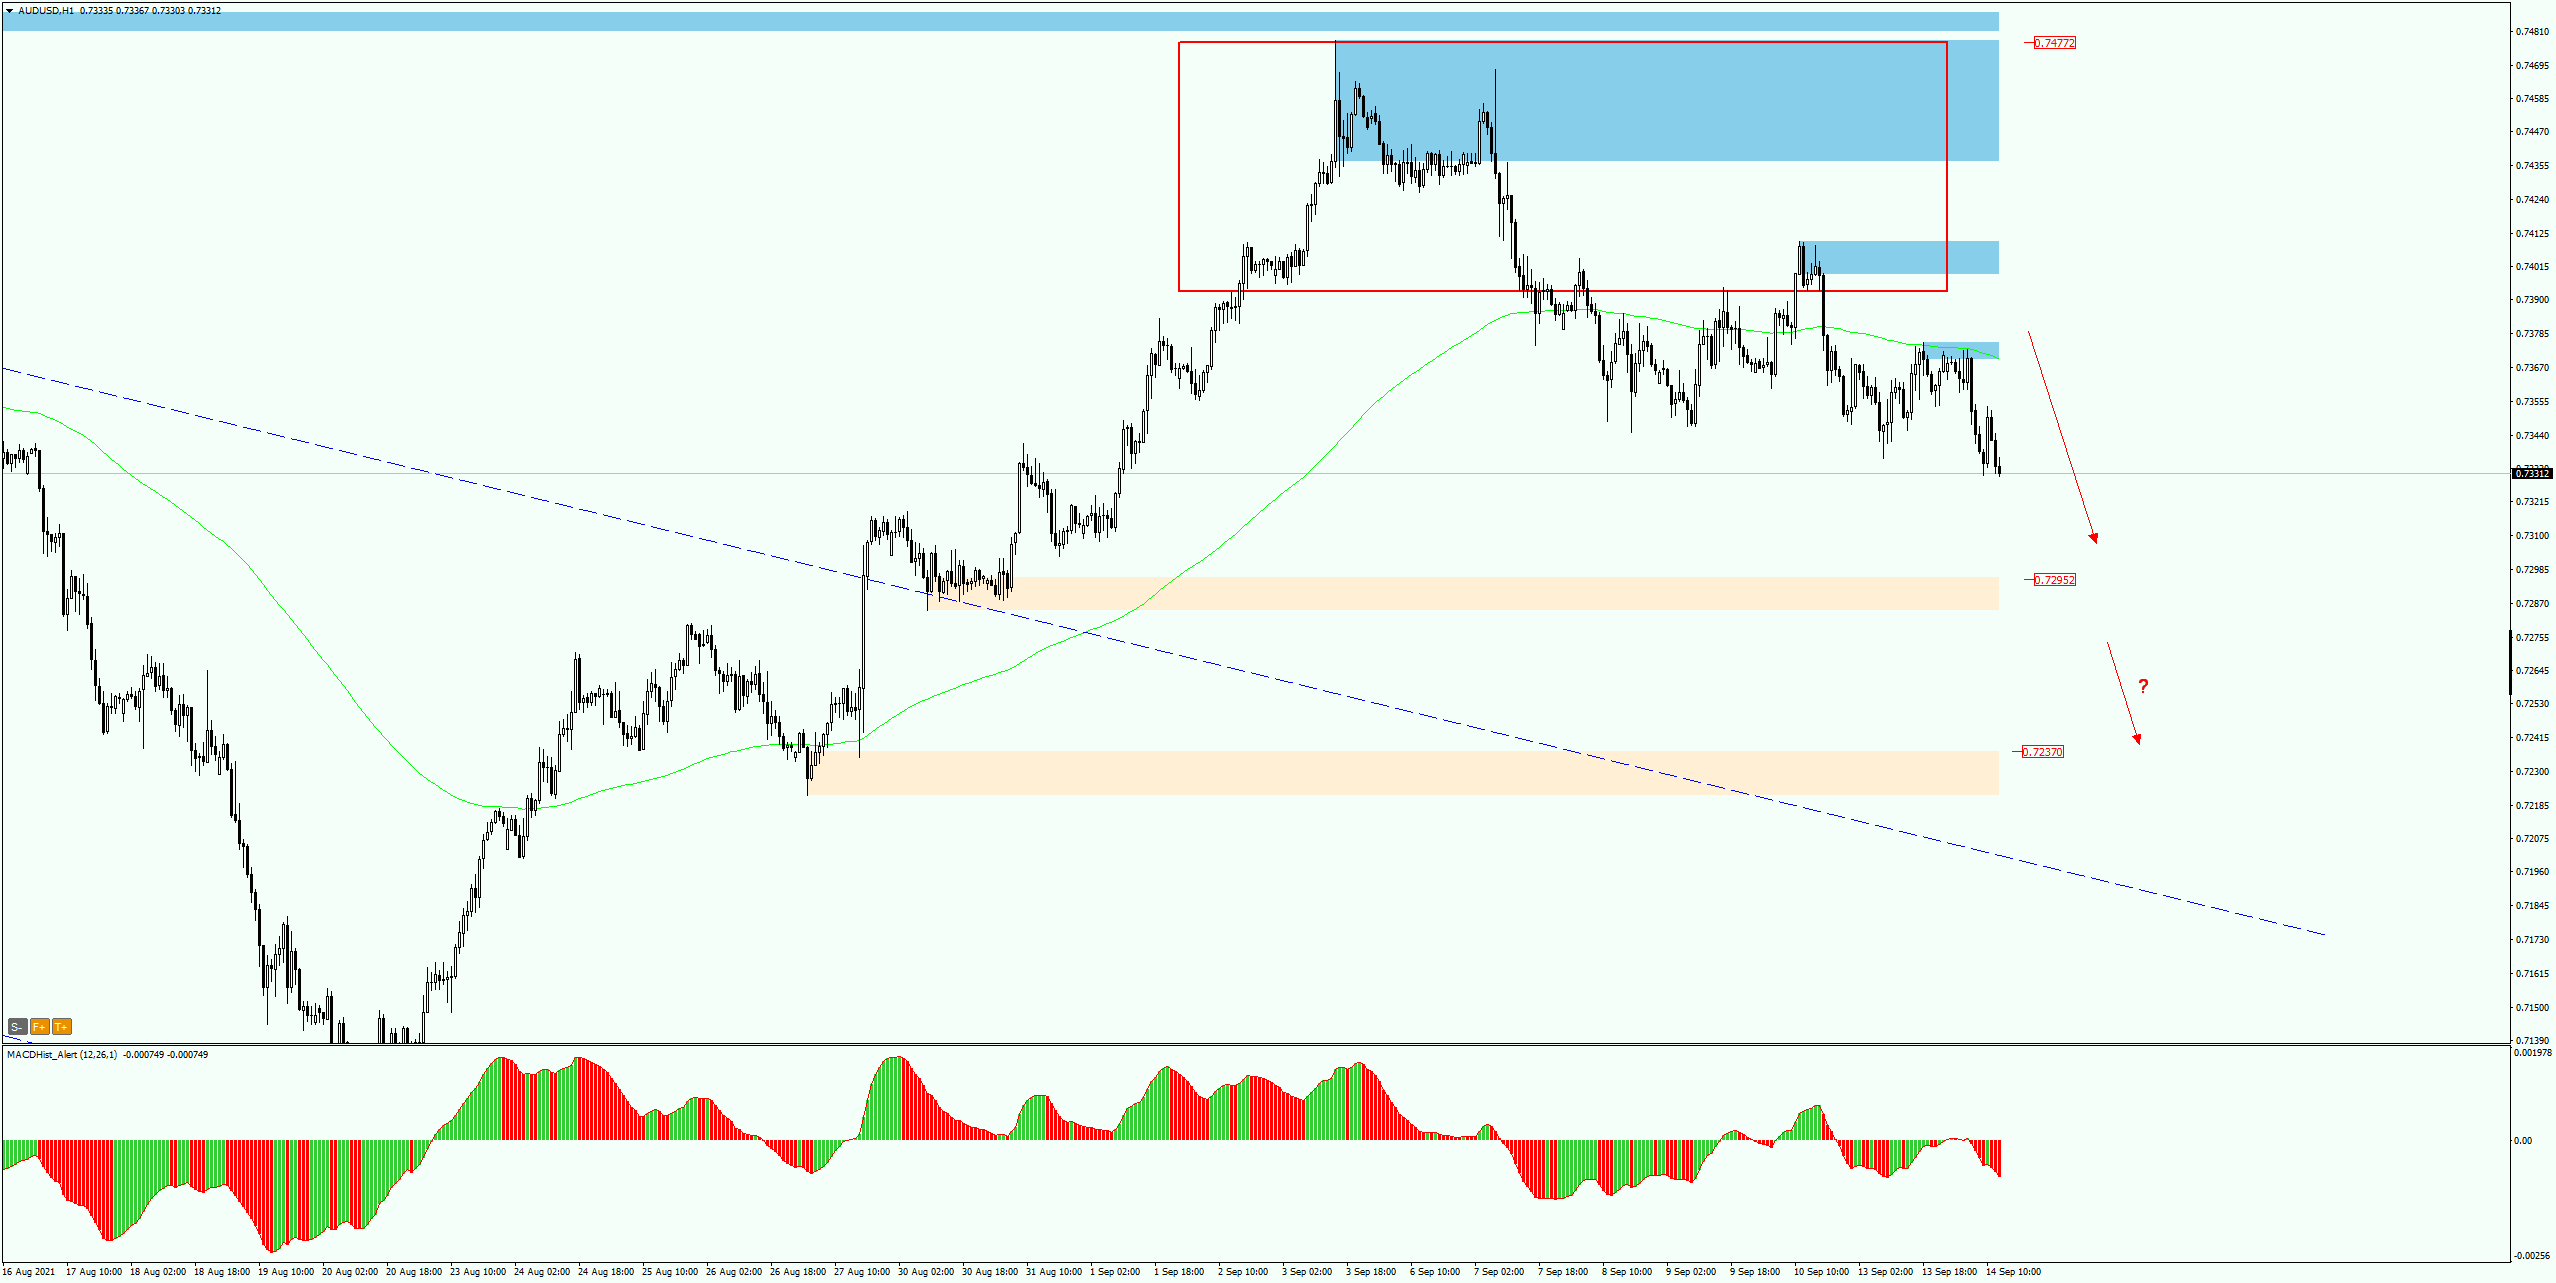
Range of possible declines can be estimated on the H1 chart. The nearest target may be the demand zone at 0.7295. If it does not withstand the supply pressure, the next target may be the demand zone starting at 0.7240.
The downward scenario will be negated, when the price overcomes the maximum of the candle forming (mother candle) IB formation.
By the way, I invite you to a live trading session :
Tuesday 15:00 GMT+1. Free entry here: Live Trading
I recommend a description of the strategy used for this analysis:
ongoing analysis https://t.me/TradewithDargo
 In our Facebook group, which you can join anytime: https://www.facebook.com/groups/328412937935363/ you will find 5 simple strategies on which my trading is based. There, every day we post fresh analyses of currency pairs and commodities. You can also visit my channel where I post my trading ideas: https://t.me/TradewithDargo


 Review")


