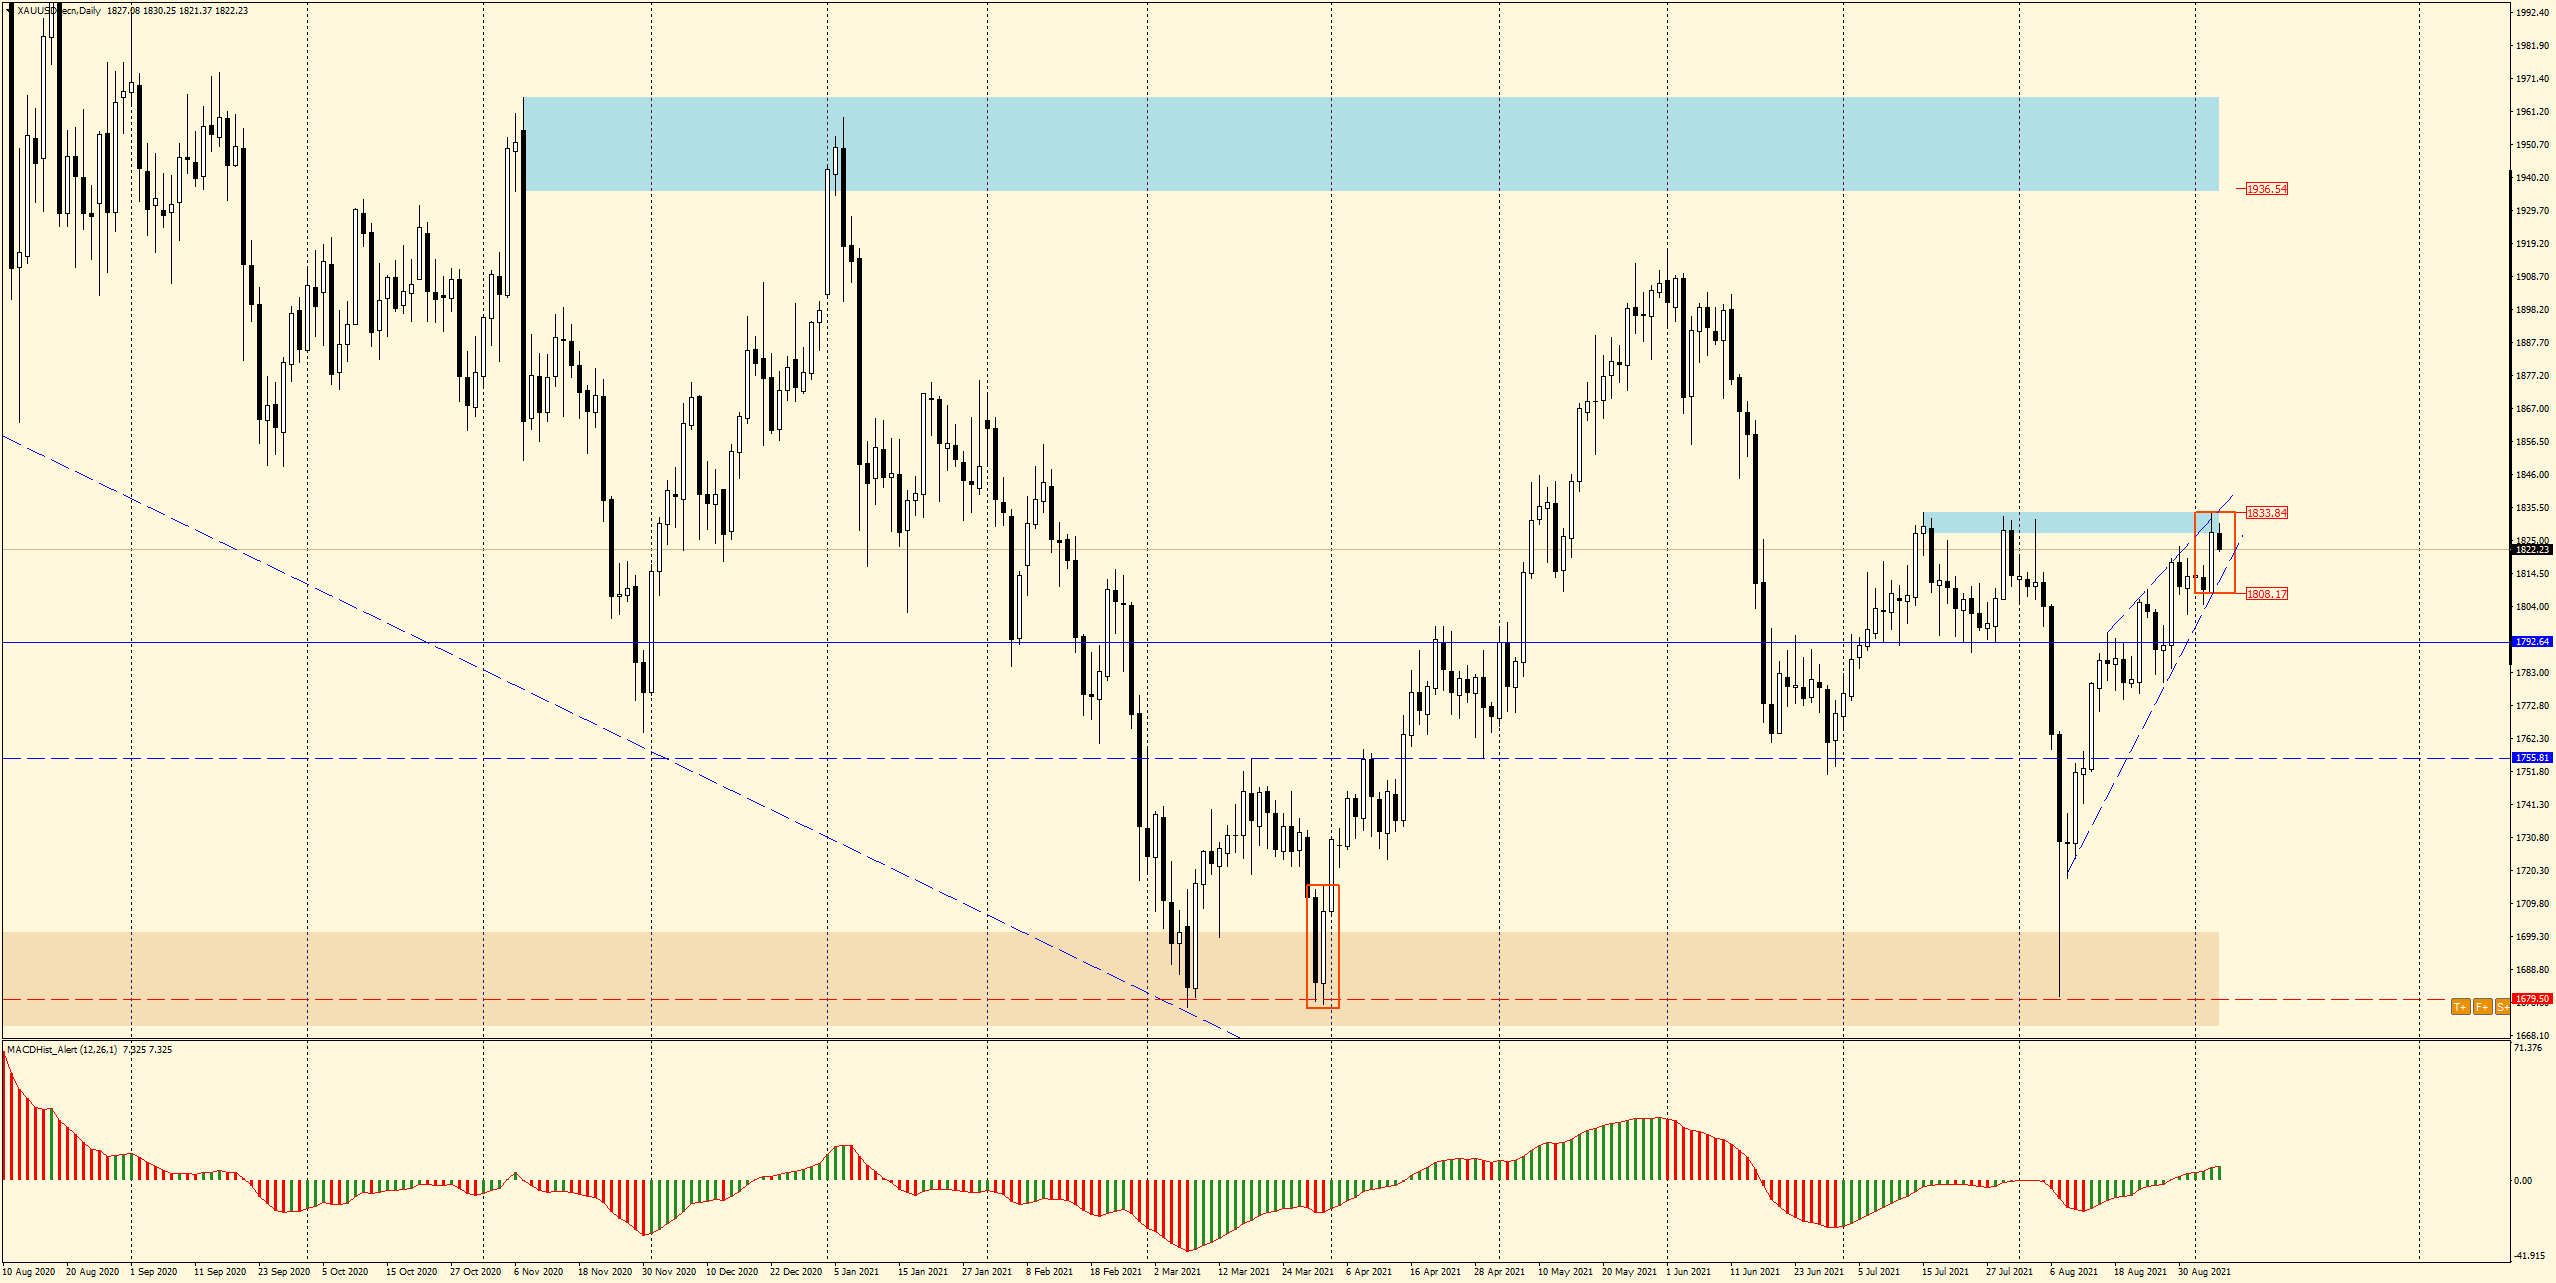
We saw spectacular declines in gold in early August when the price fell from $1,833 to $1,680/oz (-$153) on 4 consecutive trading days.
- weak US labour market data a fuel for gold price
- week starts with declines
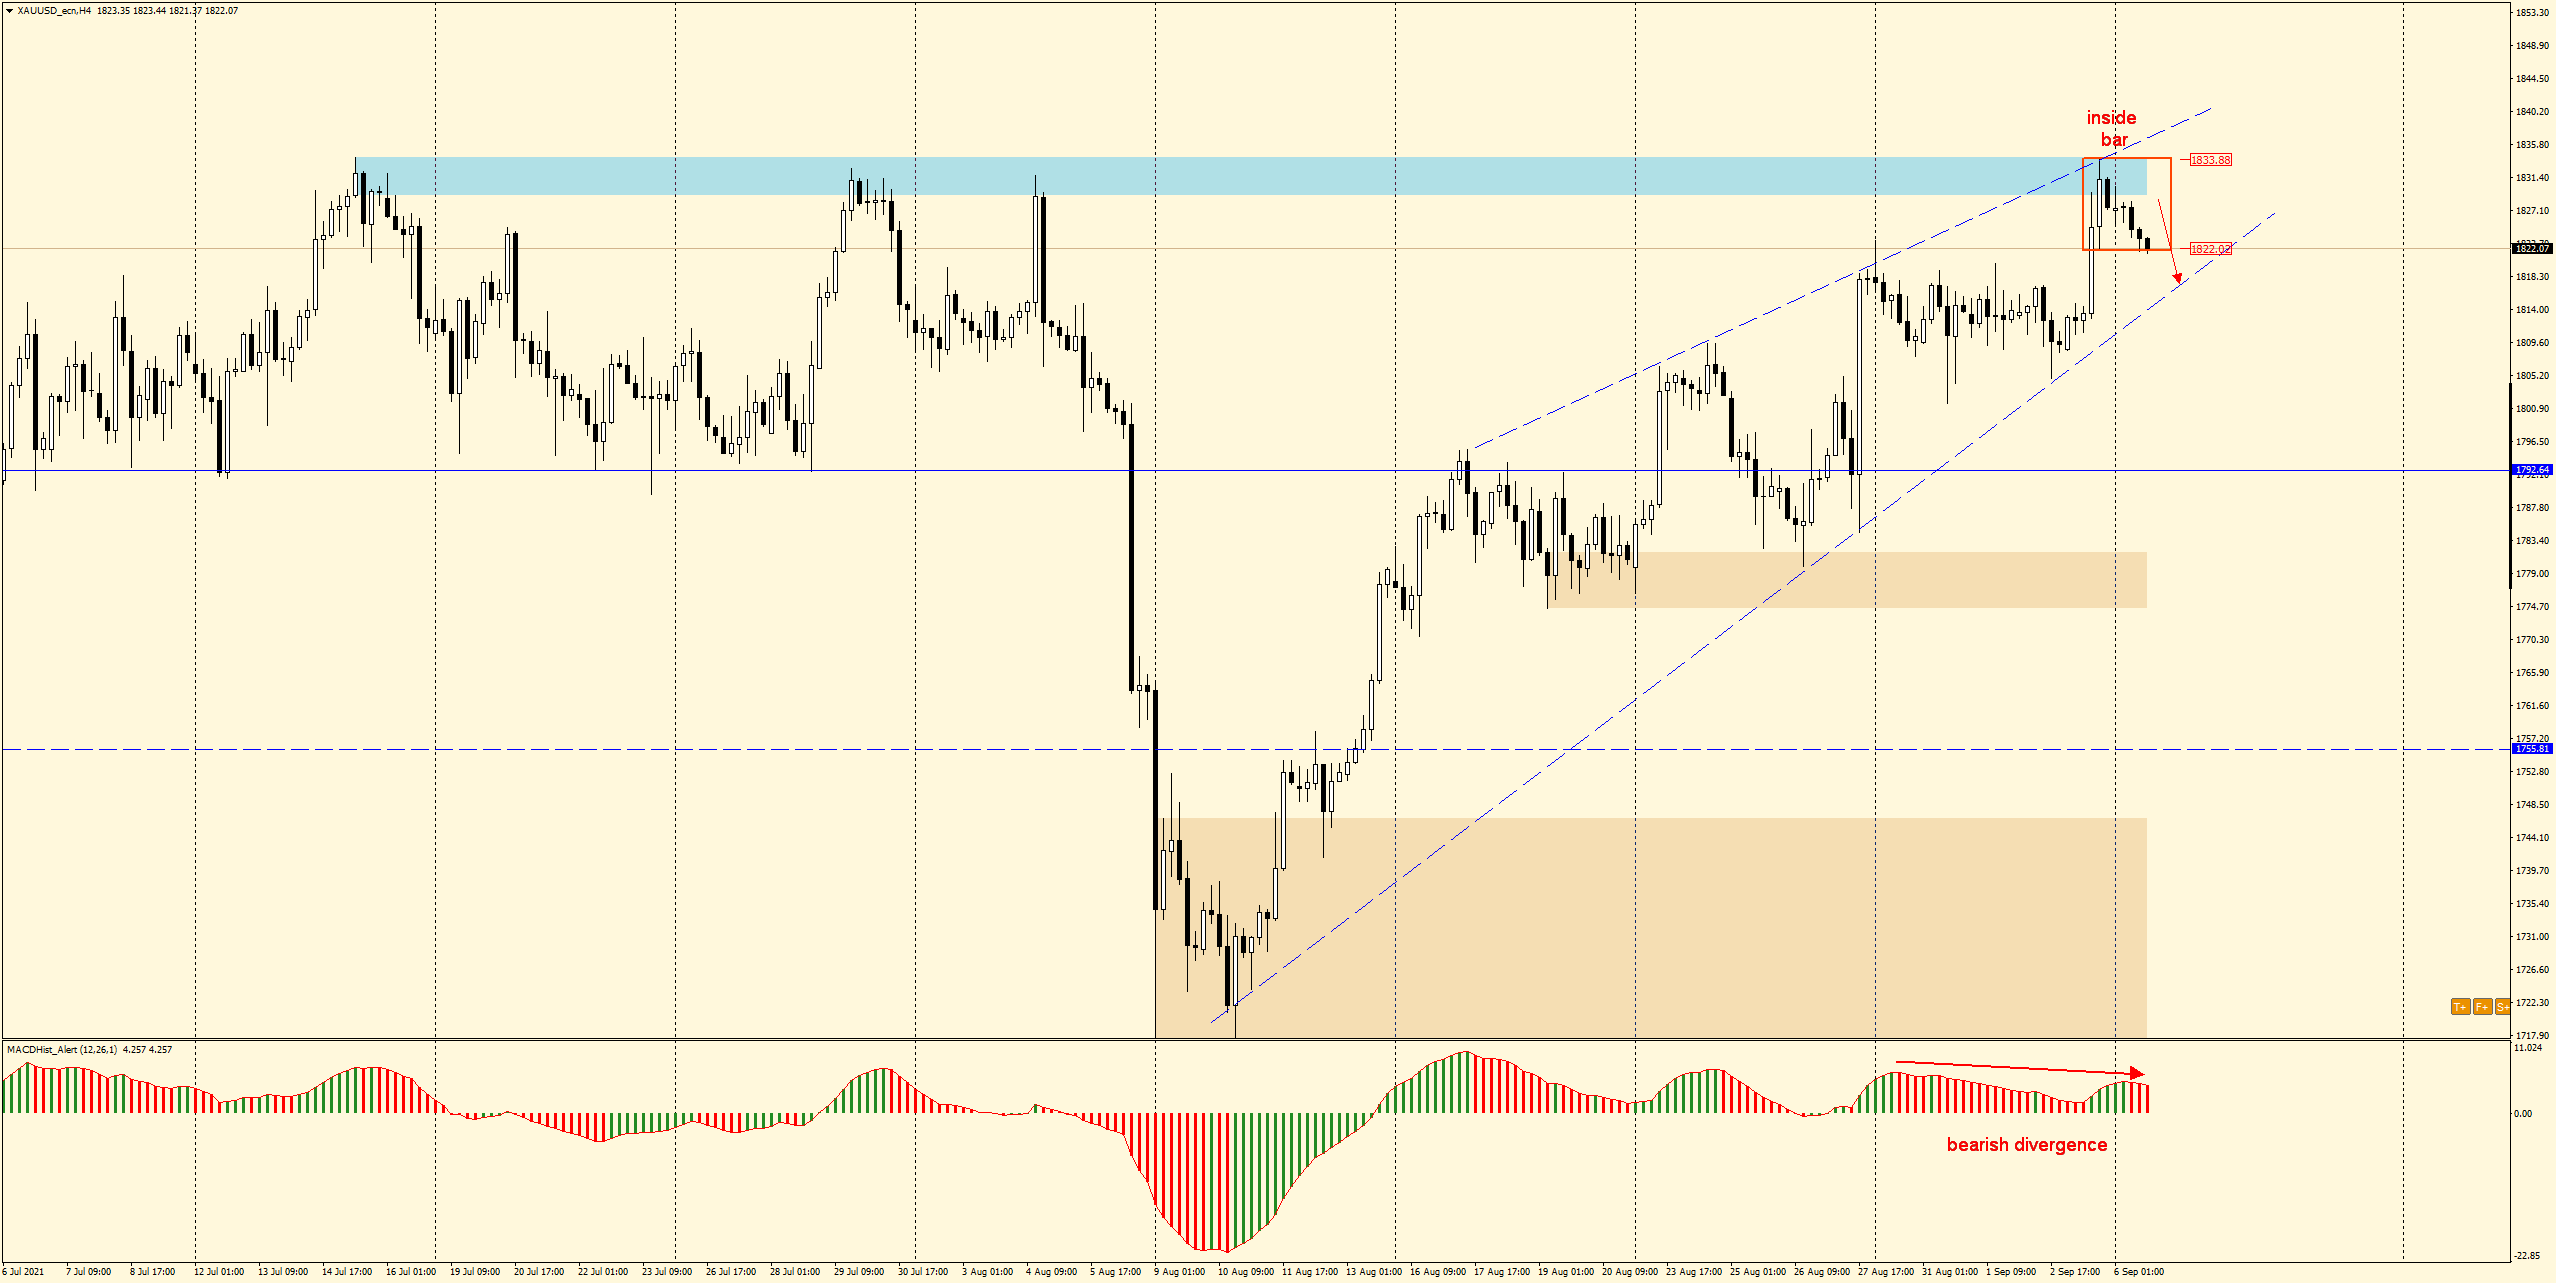
- inside bar on the resistance of the ascending wedge

But the very next day, after reaching the area of the minimum of this year, the upward correction began and gold began to regain its shine. After Friday’s weak labour market data in the USA, where payrolls turned out to be below expectations and amounted to 243 000 against the expected 665 000, the price of gold gained momentum and reached the 1883 supply zone, where the maxima from July and August are located.
Today’s day brought slight decreases, an inside bar appeared on the daily chart. MACD is still upward, the bullish divergence from 13 August has not yet been negated.

The technical picture on the H4 chart is quite clear and seems to suggest declines. This is indicated by the downward divergence initiated today. An inside bar also appeared and the maximum of the candle forming the formation (mother candle) is located at the resistance of the ascending wedge.
If the price breaks out of the inside bar downwards, it may lead to further declines, at least to the support of the mentioned wedge. Further declines are possible and if the support is overcome – the price may move towards the S/R level 1793-95.
By the way, I invite you to a live trading session :
Tuesday 15:00 GMT+1. Free entry here: Live Trading
I recommend a description of the strategy used for this analysis:
ongoing analysis https://t.me/TradewithDargo
 In our Facebook group, which you can join anytime: https://www.facebook.com/groups/328412937935363/ you will find 5 simple strategies on which my trading is based. There, every day we post fresh analyses of currency pairs and commodities. You can also visit my channel where I post my trading ideas: https://t.me/TradewithDargo


