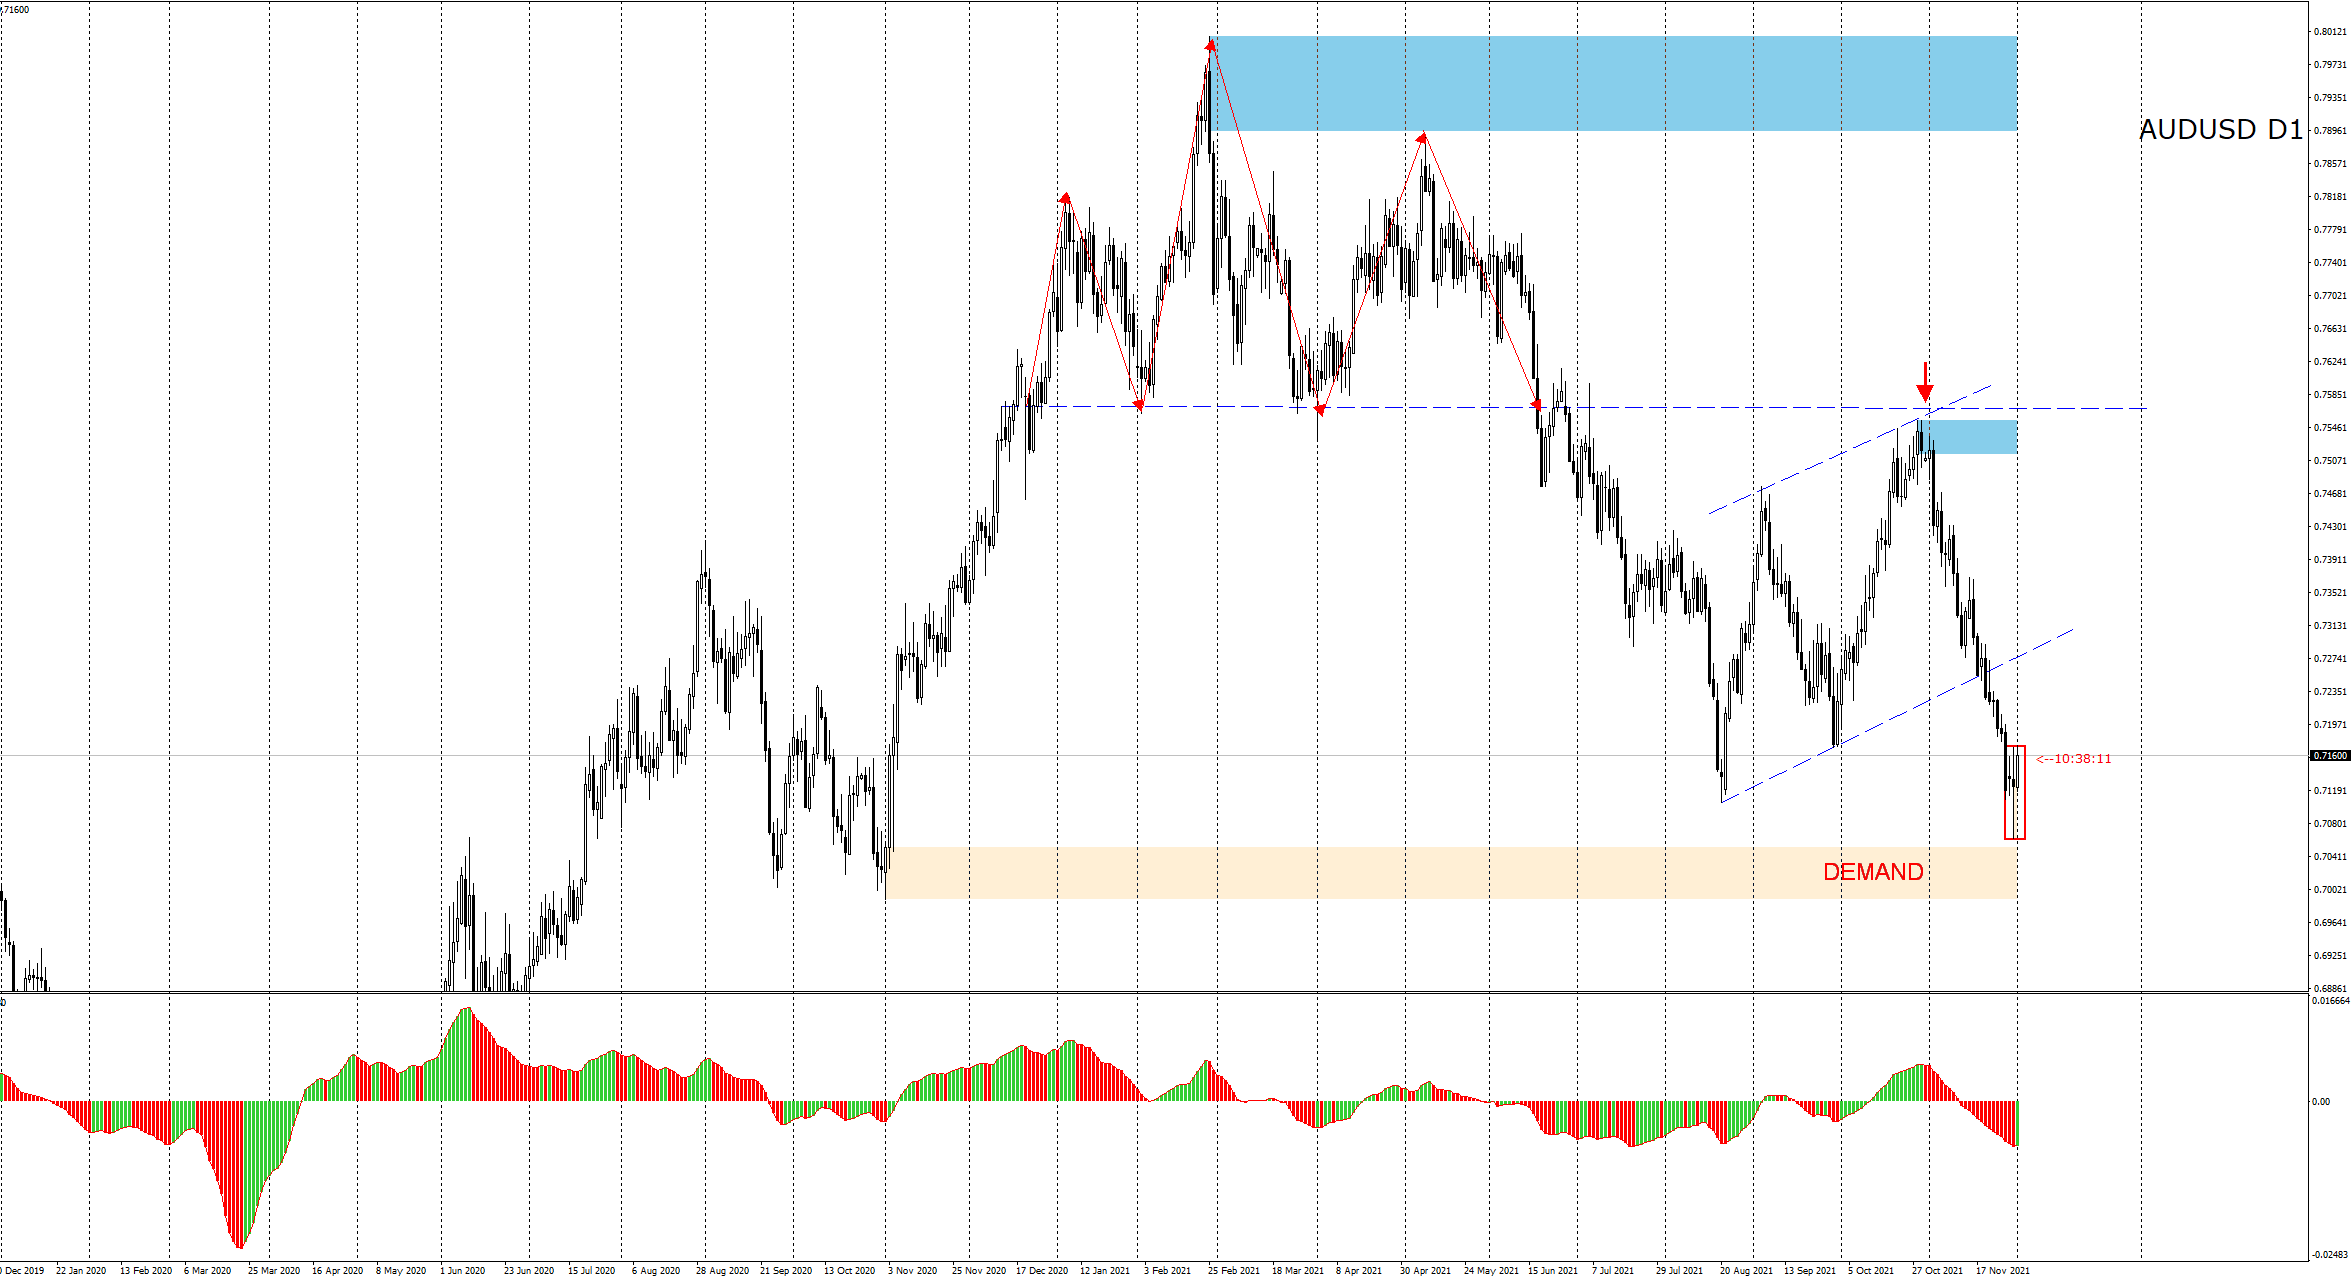
The pair Australian dollar against the US dollar has been moving in a downward trend since the end of February this year. The intensification of declines took place after breaking the neck line of the head and shoulders formation, which took almost 6 months to form.
- head and shoulders formation
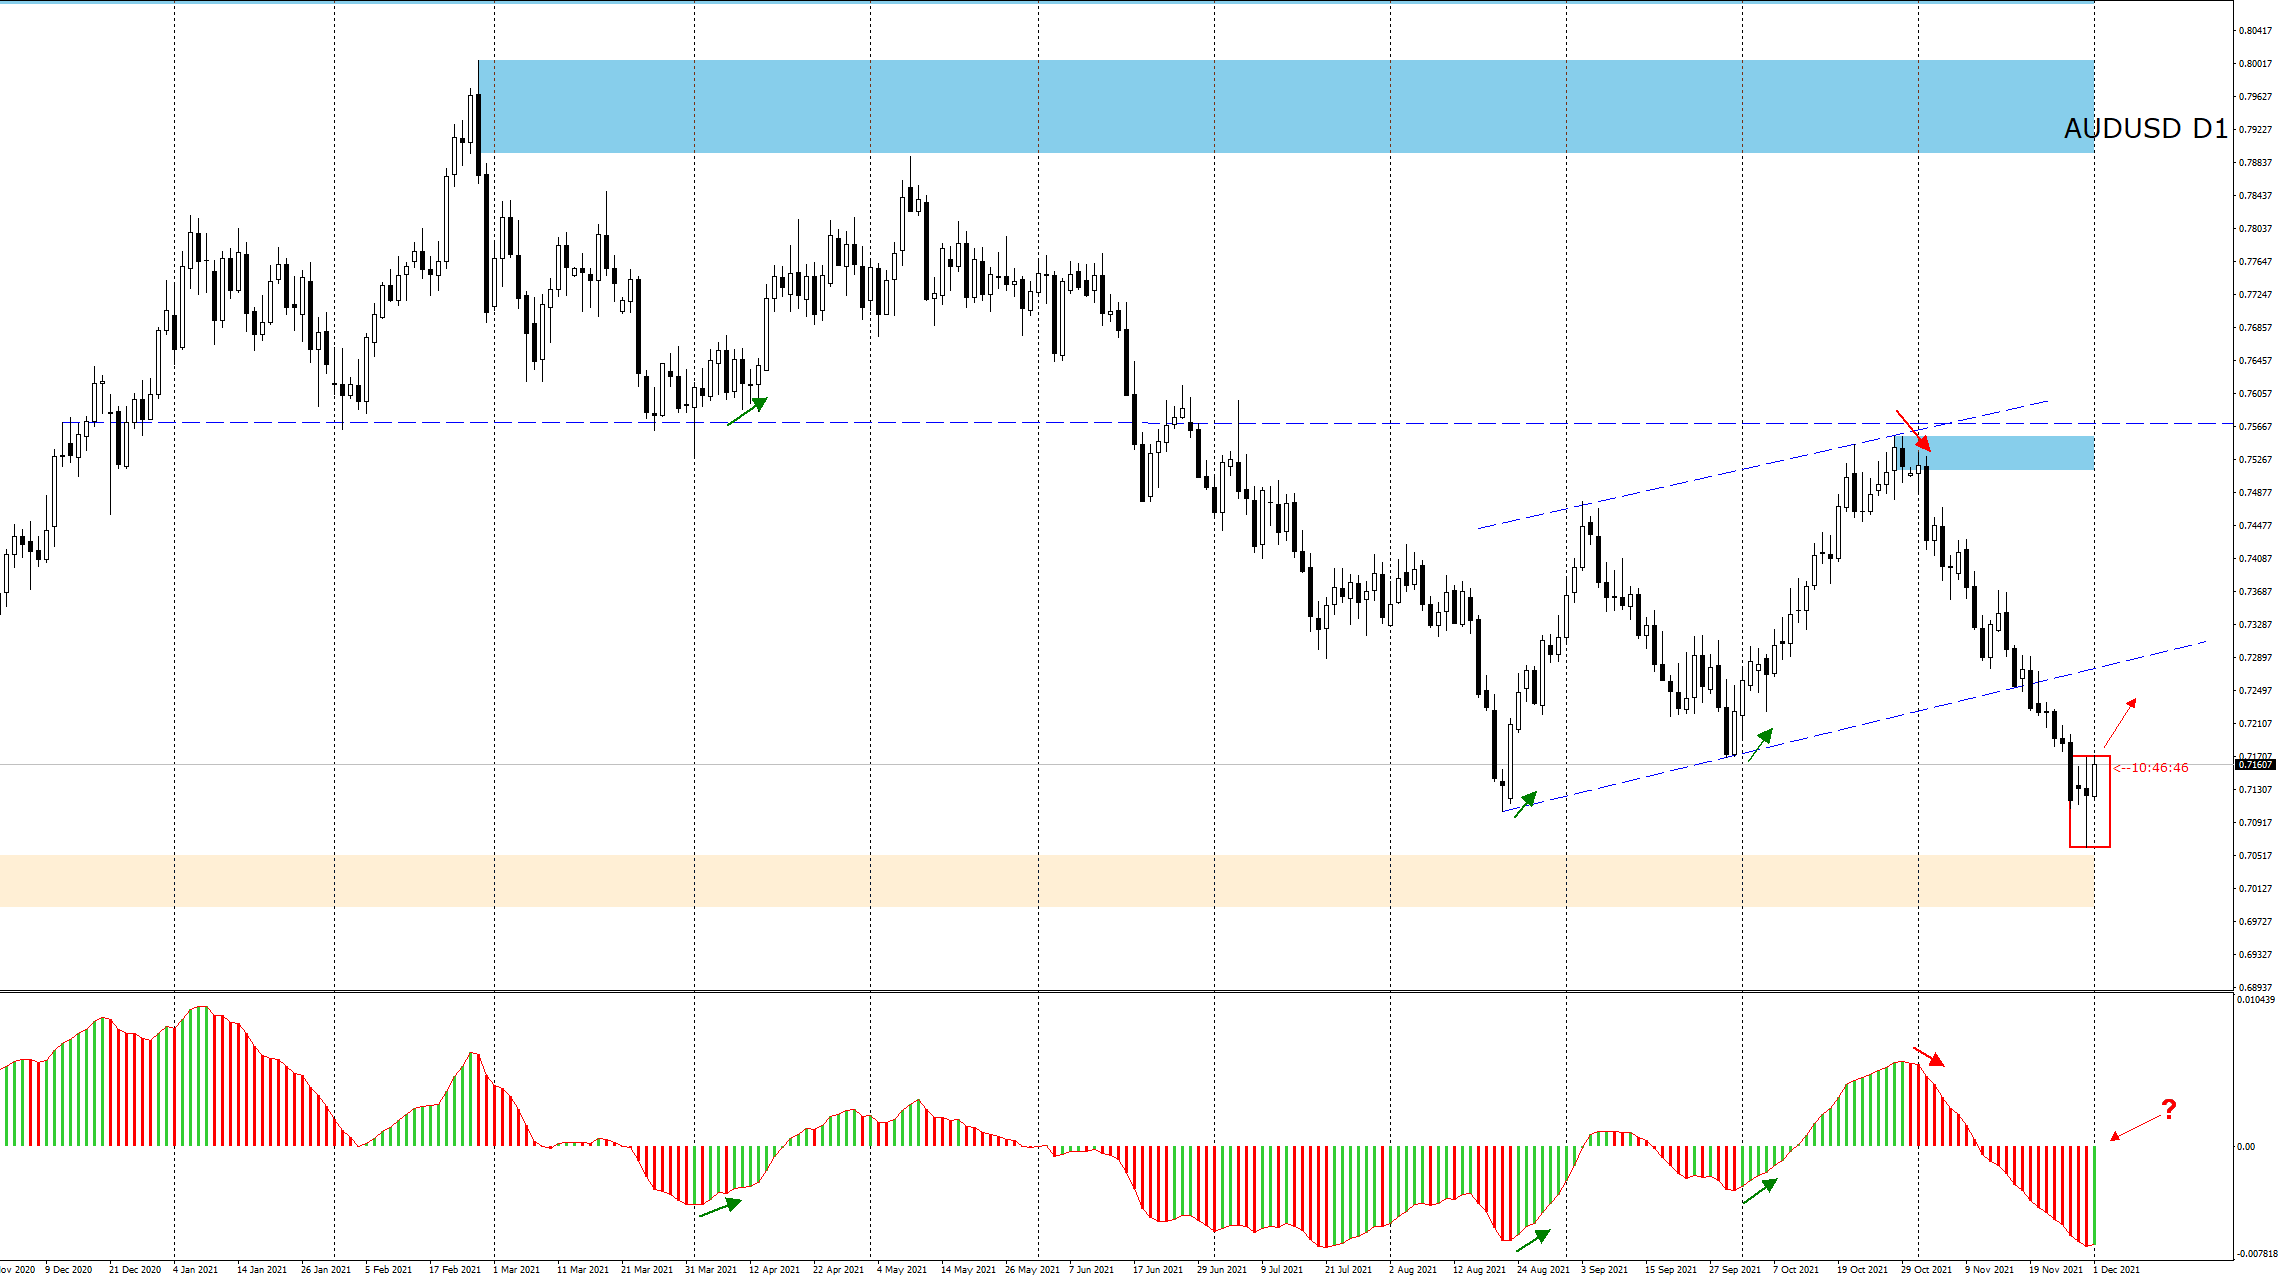
- Outside bar on support and supply zone
- MACD may indicate direction
H&S formations are usually a signal for a change of trend and the current situation on the chart proves it. The declines that started in February have already reached over 950p.

Yesterday’s statement by J. Powell signalling a faster than previously expected normalisation of the monetary policy in the USA resulted in the strengthening of the USD against other currencies.
Yesterday’s daily candle engulfed the previous one and formed an outside bar formation. The minimum of the candle is located in the area of the demand zone.

Characteristic for this pair is the behaviour of the MACD, which when moving from a downward phase to an upward phase signalled the beginning of upward corrections.
If history was to repeat itself, if the breakout of the upper limit of the formation occurs and is supported by the upward MACD – it may be another signal for the beginning of the upward swing – bullish correction.
Wednesday, 1 December at 13:00 I will have basic live trading session. We will discuss the current macro situation and pairs AUDUSD, GBPUSD, GOLD and others.Link to the trading room here: LIVE TRADING ROOM
Analyses, comments, discussion: https://t.me/TradewithDargo
I recommend a description of the strategy used for this analysis:PA+MACD
 In our Facebook group, which you can join anytime: https://www.facebook.com/groups/328412937935363/ you will find 5 simple strategies on which my trading is based. There, every day we post fresh analyses of currency pairs and commodities. You can also visit my channel where I post my trading ideas: https://t.me/TradewithDargo


