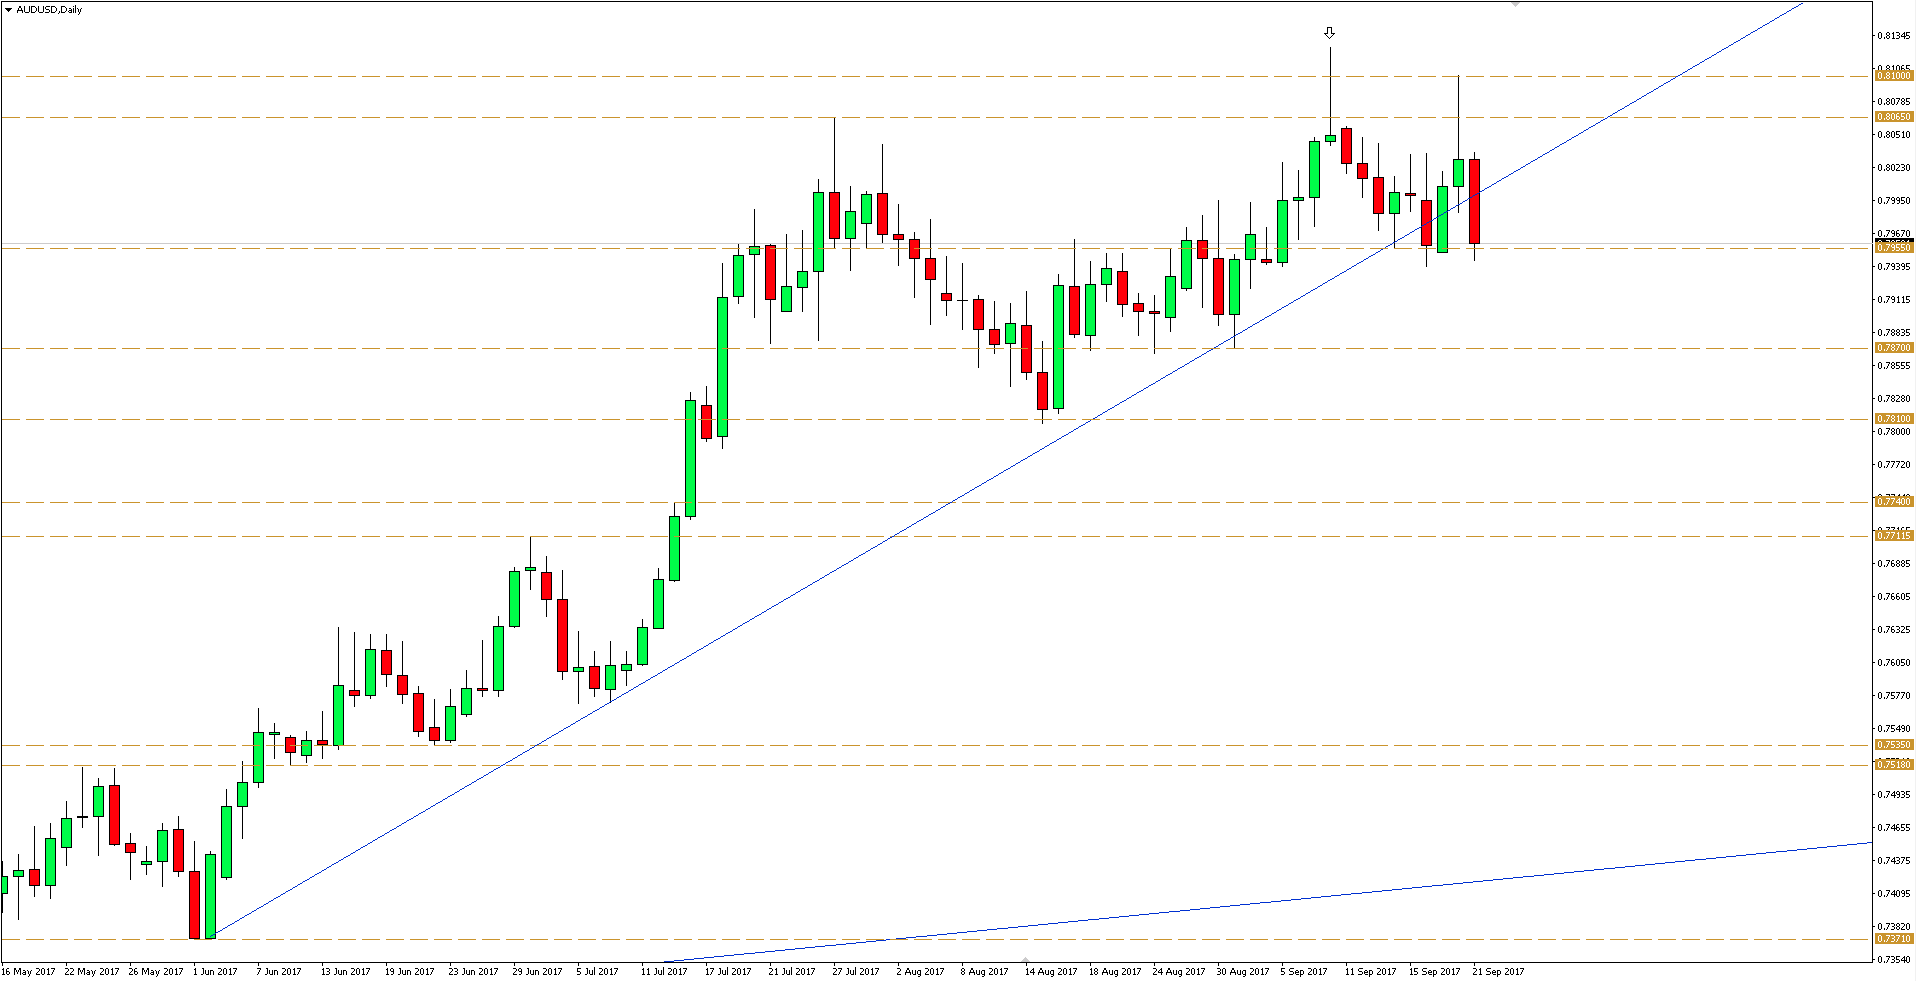
On the daily chart of AUDUSD, it can be seen that the pair on Monday broke the bullish trend line drawn from the low of June this year. However, for two consecutive days the price returned above the trend line, and yesterday buyers attacked the resistance zone between 0.8065 – 0.8100.
Today’s session indicates return to declines (under the trendline) and a test of support area 0.7955.
Interestingly, it also looks on the H4 chart, where support is now being provided by the channel line that began forming more than a month ago. This line coincides with the 0.7955 support area, thus providing an additional confluence factor.
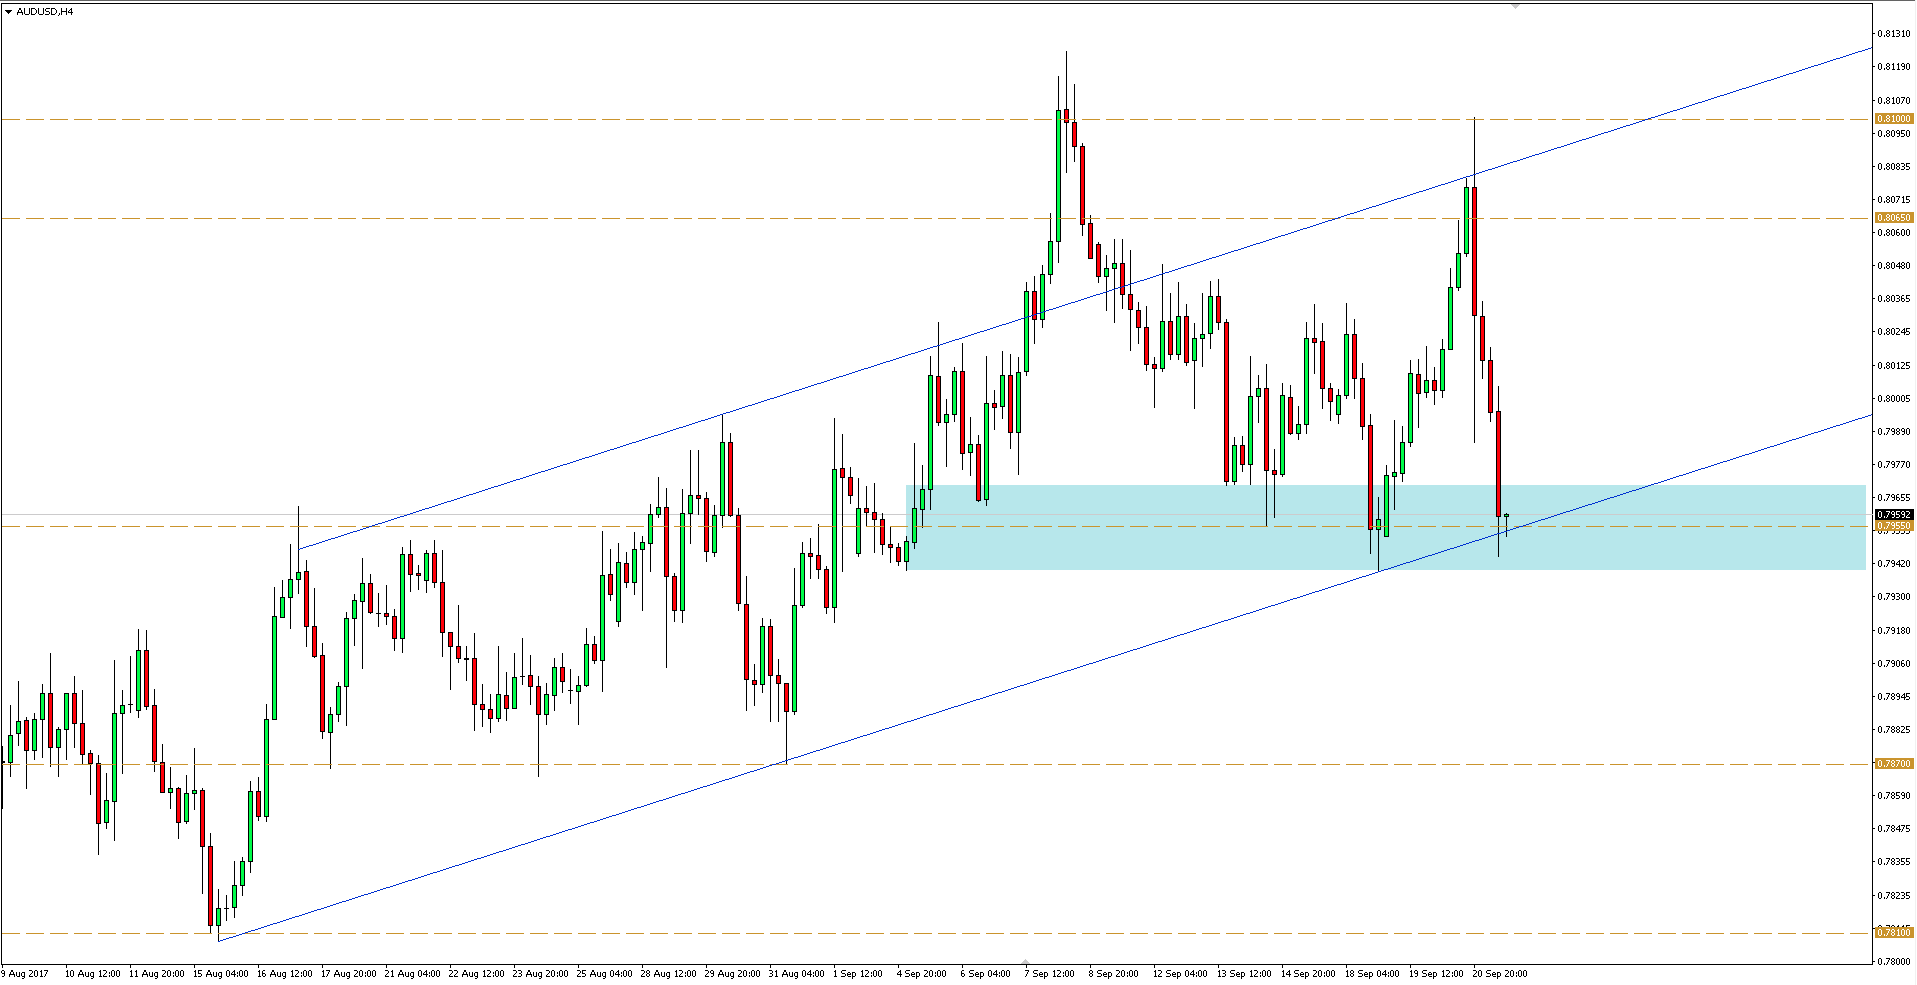
Overcoming this area and closing under Monday’s minima would be very likely to drop further. The nearest support/goals would then be at levels 0.7870 and 0.7810. Alternatively, a reflection from the confluence zone will continue to hold the pair in consolidation.


 Review")


