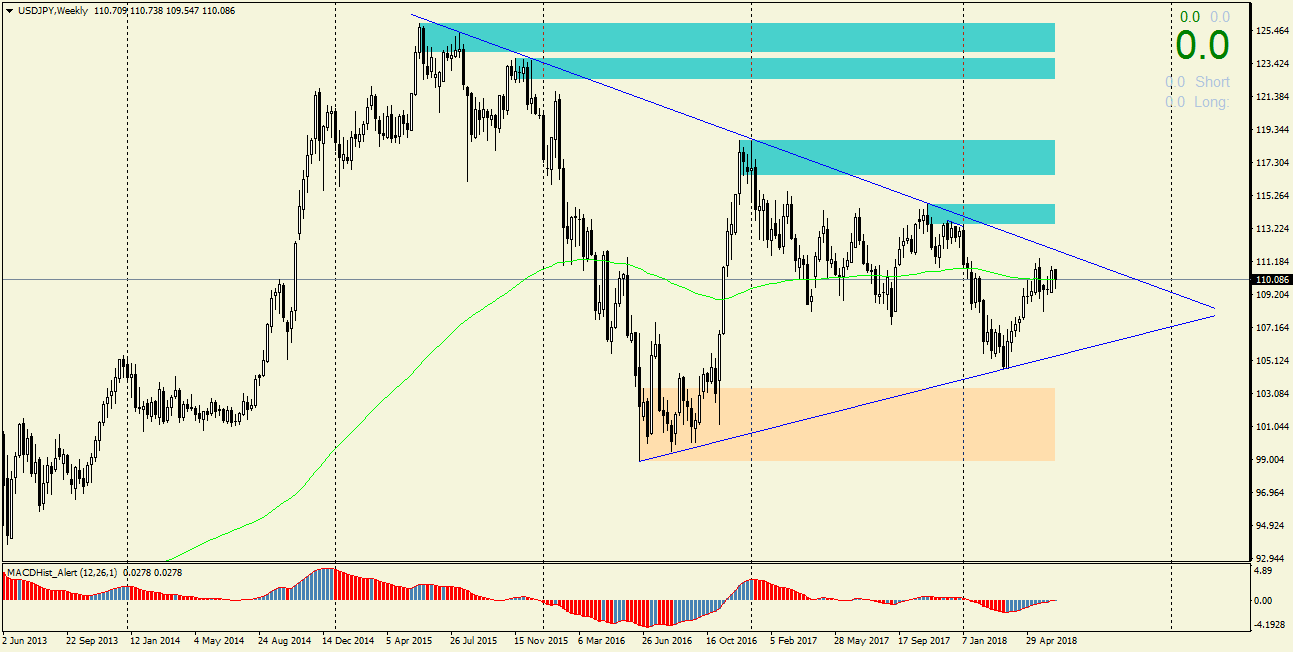
USDJPY – recently on this pair on the lower TF there is quite a lot of chaos if we look at it from the technical analysis point of view. So let’s look at the weekly chart where from a greater perspective you can see that the pair moves in a triangle whose sides several times served as resistance in the upper case and support in the case of the lower arm.
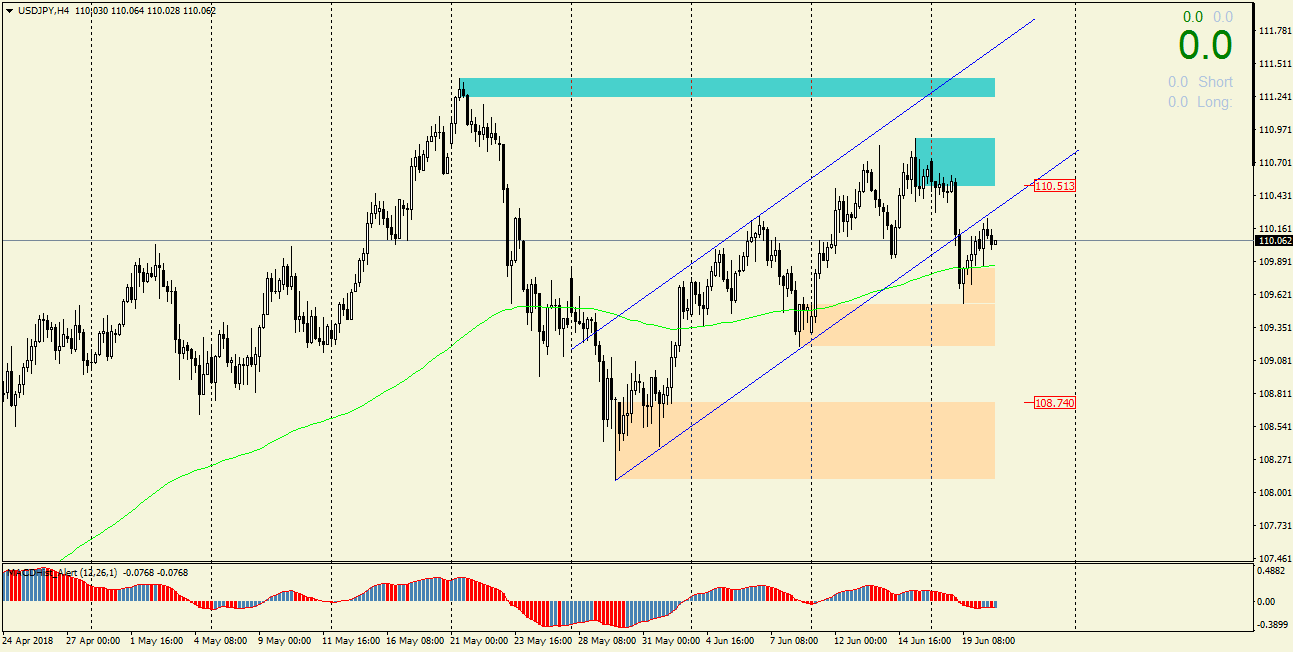
When going to the H4 chart, we can see that for several weeks the pair was moving in the growth channel from which left it on19.06 in a rather dynamic style creating a local minimum at the level of 109.55.
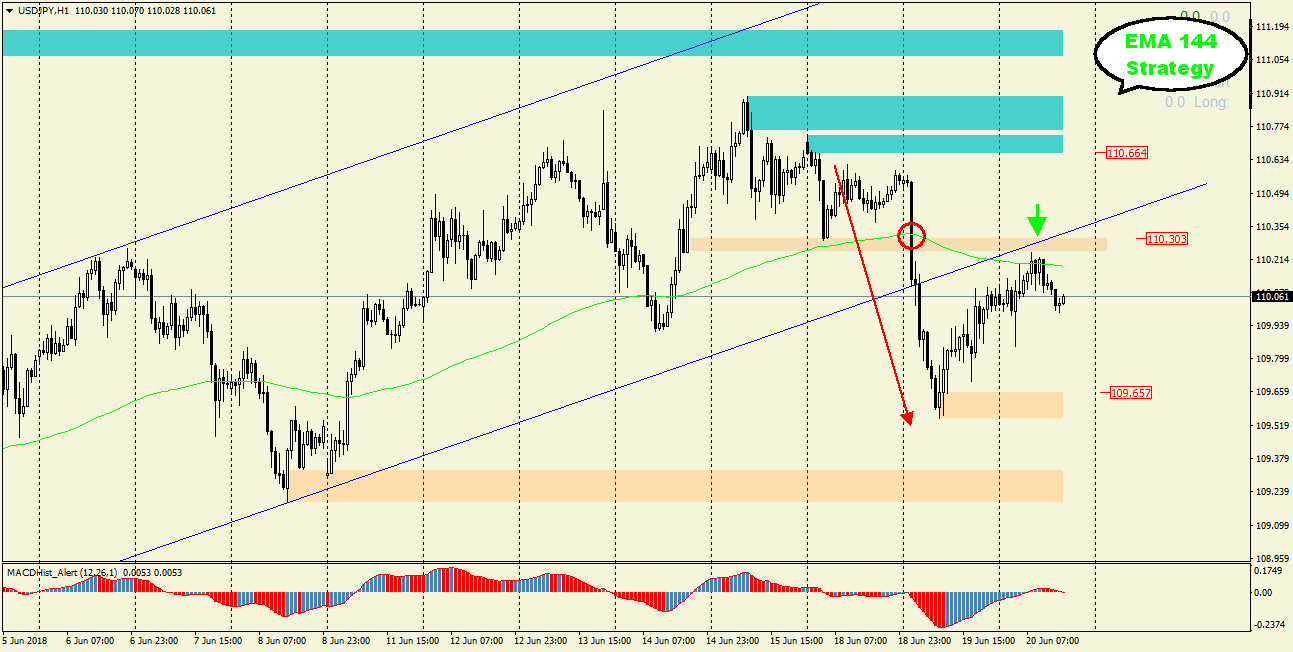
Analyzing the H1 chart, we can use the EMA144 strategy, because the situation in the chart quite well meets the assumptions of this strategy.
The average EMA144 was broken – (marked in red), the price returned to the average, additionally, there is the previously defeated upward trend line. It is worth observing the price behavior at the aforementioned trend line and think about a short order around 110.30-110.40 with SL above the last high of 110.65 and TP 109.65.


 Review")


