CADJPY since the memorable night on January 2/3 this year, when flash crash on pairs with Jen led to the setting of a 2-year minimum at 76.75, moves in an upward trend and last week set a maximum this year 82.235.
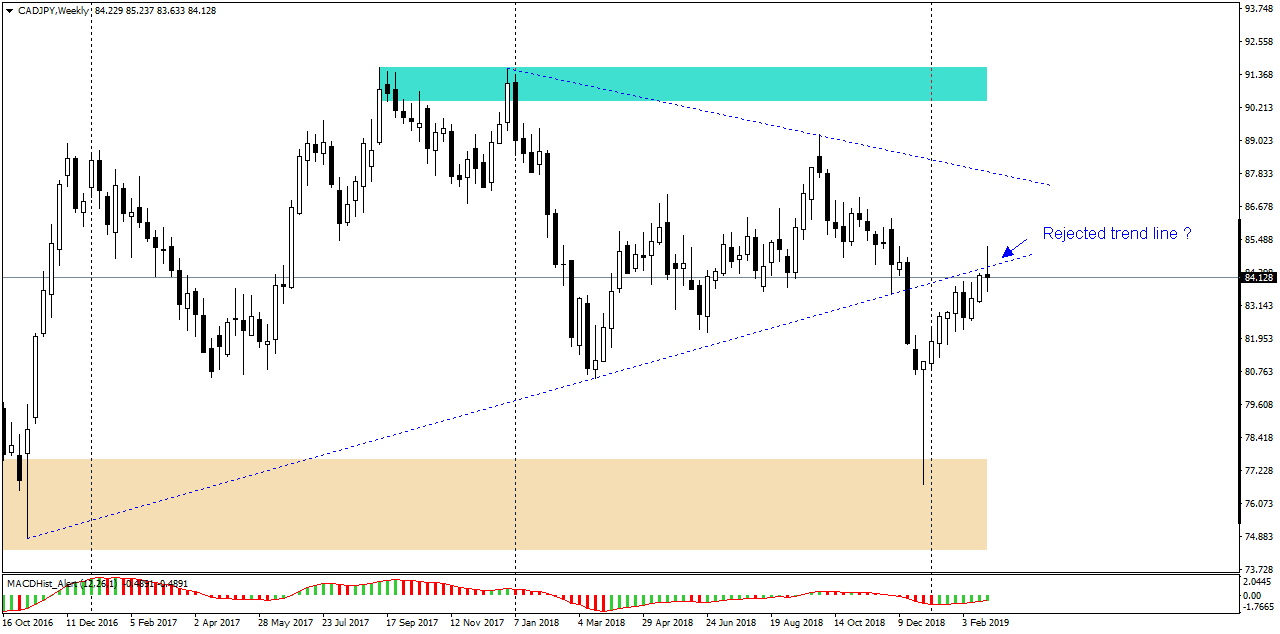
Last week notations (chart above) formed a candle with a large upper wick indicating the rejection of an upward trend line drawn from 2016 and 2018 minimum.
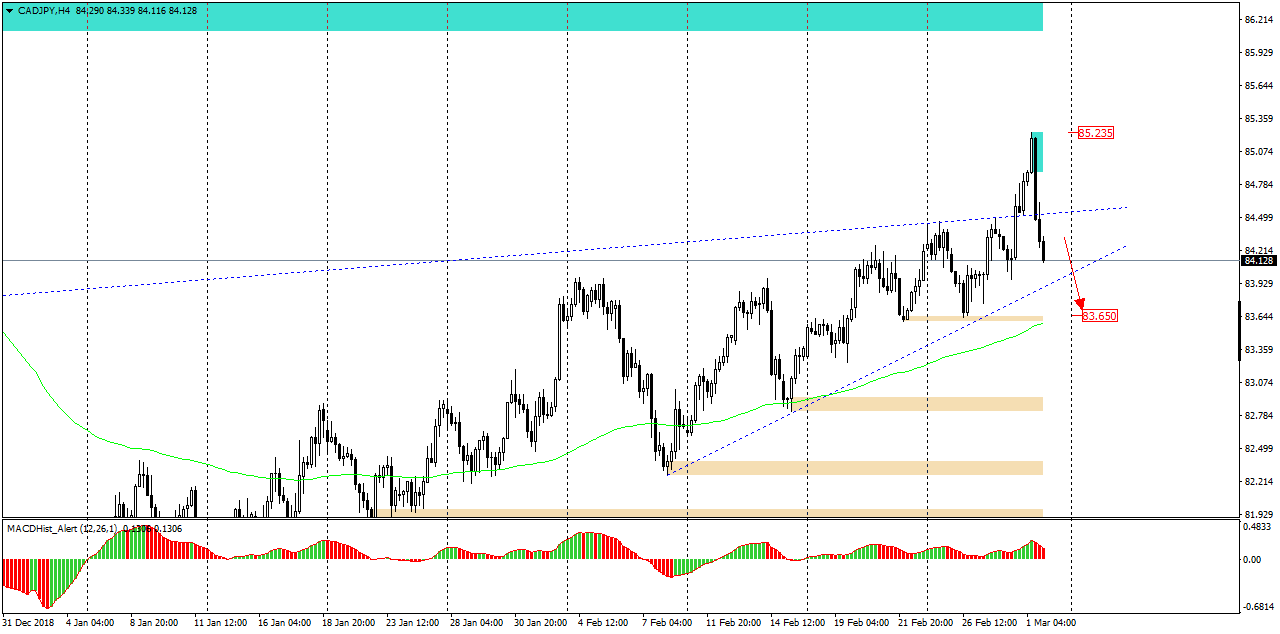
Analyzing the four-hour chart we will notice that the price is approaching the local trend line since the beginning of February this year and its overcoming may lead to further drops to the nearest demand level of 83.65. The level that if overcome may negate the bearish scenario is the mentioned rejected 3-year trend line last week.
Join us in our new group for serious traders, get fresh analyses and educational stuff here: https://www.facebook.com/groups/328412937935363/


 Review")


